Stress-test the complete plan
Rerun the plan using reordered historical market returns, keeping its income, expenses, taxes, and withdrawals connected.
Monte Carlo simulations
Explore how your plan holds up across hundreds of reordered historical market sequences. See the range, then look inside the runs that explain it.
See what’s possible
Go beyond a single projection to see how different return sequences affect the years your money needs to cover.
Read the detailed guideRerun the plan using reordered historical market returns, keeping its income, expenses, taxes, and withdrawals connected.
Explore the outcome range and the share of runs that avoid funding shortfalls.
Inspect a lean, middle, or fortunate run to see the market sequence and the years behind its result.
Explore the details
The historical simulator replays a chosen sequence, while Plan resilience explores many rearranged historical paths. The two tools answer complementary questions. One lets you examine a particular period and its timing; the other helps you see whether the plan’s result depends heavily on which path arrives.
From a question to a clearer picture
Plan resilience tests the whole household plan against rearranged historical returns. Use the headline to orient yourself, then investigate the paths behind it.
Select an index or an index timeline, including a change in allocation after retirement. Choose 100, 300, or 500 runs. Deal settings let you change how historical years are grouped and which inflation assumptions each run lives.
Each run settles the household’s income, spending, taxes, withdrawals, and permitted sales. Read the split between runs that kept every home, needed a home sale, and ran short, alongside the share that avoided shortfalls.
Select a run card or filter and sort Every run. Open a run’s complete projection to follow the market it encountered, the withdrawal years, and the point where money became tight. Use Deal it again to explore another set.
Connect the whole plan
A success rate summarizes many complete forecasts. Opening an individual run lets you examine the cash flow behind its outcome: which resources cover costs, what taxes are paid, and where money is invested. The flow view makes those annual mechanics easier to follow after selecting a run to investigate.
One way to use it · illustrative scenario
Imagine a couple who expect investment withdrawals to fund part of retirement. They want to explore the effect of reducing one discretionary expense while keeping their retirement dates unchanged.
Try an example planStart a What-If in the projection and lower their annual travel budget from $12,000 to $8,000. Open Plan resilience with the same market, sampling, and inflation choices.
The comparison gives the original and edited plans identical futures. Examine the before-and-after outcome rate, which runs changed their ending, and whether difficult runs fail later or avoid a forced home sale.
The useful result is how that specific budget choice affects the tested paths. It provides a basis for discussing flexibility without turning a simulated success rate into a promise.
Make sense of what you see
The outcome cards separate these experiences. A run that funds every year only after a permitted property sale counts as making it, while the sale remains visible as a different kind of retirement.
The shaded bands show the spread across runs at each year. Their edges may belong to different runs from year to year. Choose an individual card to follow one complete path.
Run cards connect their ending balances with the history dealt around retirement. Compare the timing of losses and withdrawals, and check the money basis before interpreting large future-dollar balances.
A little more detail
It describes sampling uncertainty in the share of runs that avoided shortfalls, using a Wilson 95% interval. It does not measure whether your inputs are correct or whether future markets resemble the historical record.
The default uses blocks of up to 20 consecutive historical years, avoiding repeats where the available history allows. Shorter records can require reuse. Other methods include restarting history, rolling historical stretches, shorter blocks with replacement, and drawing years independently. The method can change the result.
The page’s index, inflation, sampling, run-count, and deal settings do not overwrite the plan’s balances or return assumptions. Opening a selected run lets you inspect that scenario with the ordinary projection available for comparison.
Keep exploring
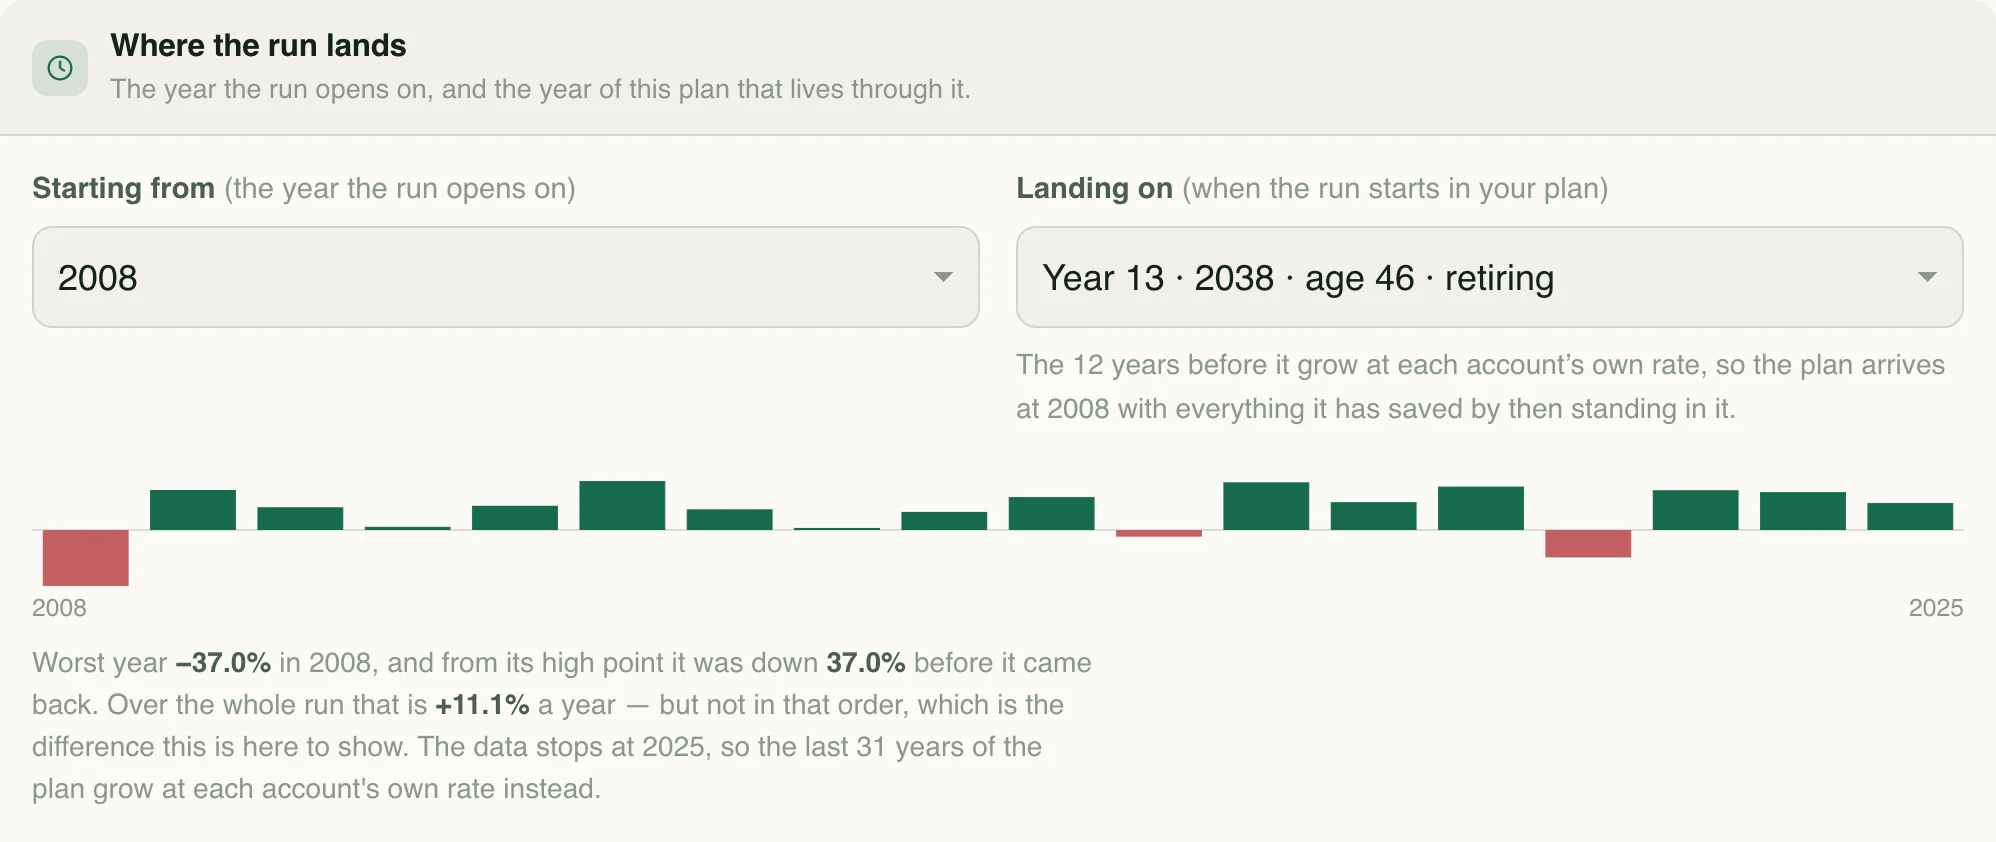
Replay historical market returns and explore how the timing of downturns changes your financial plan.
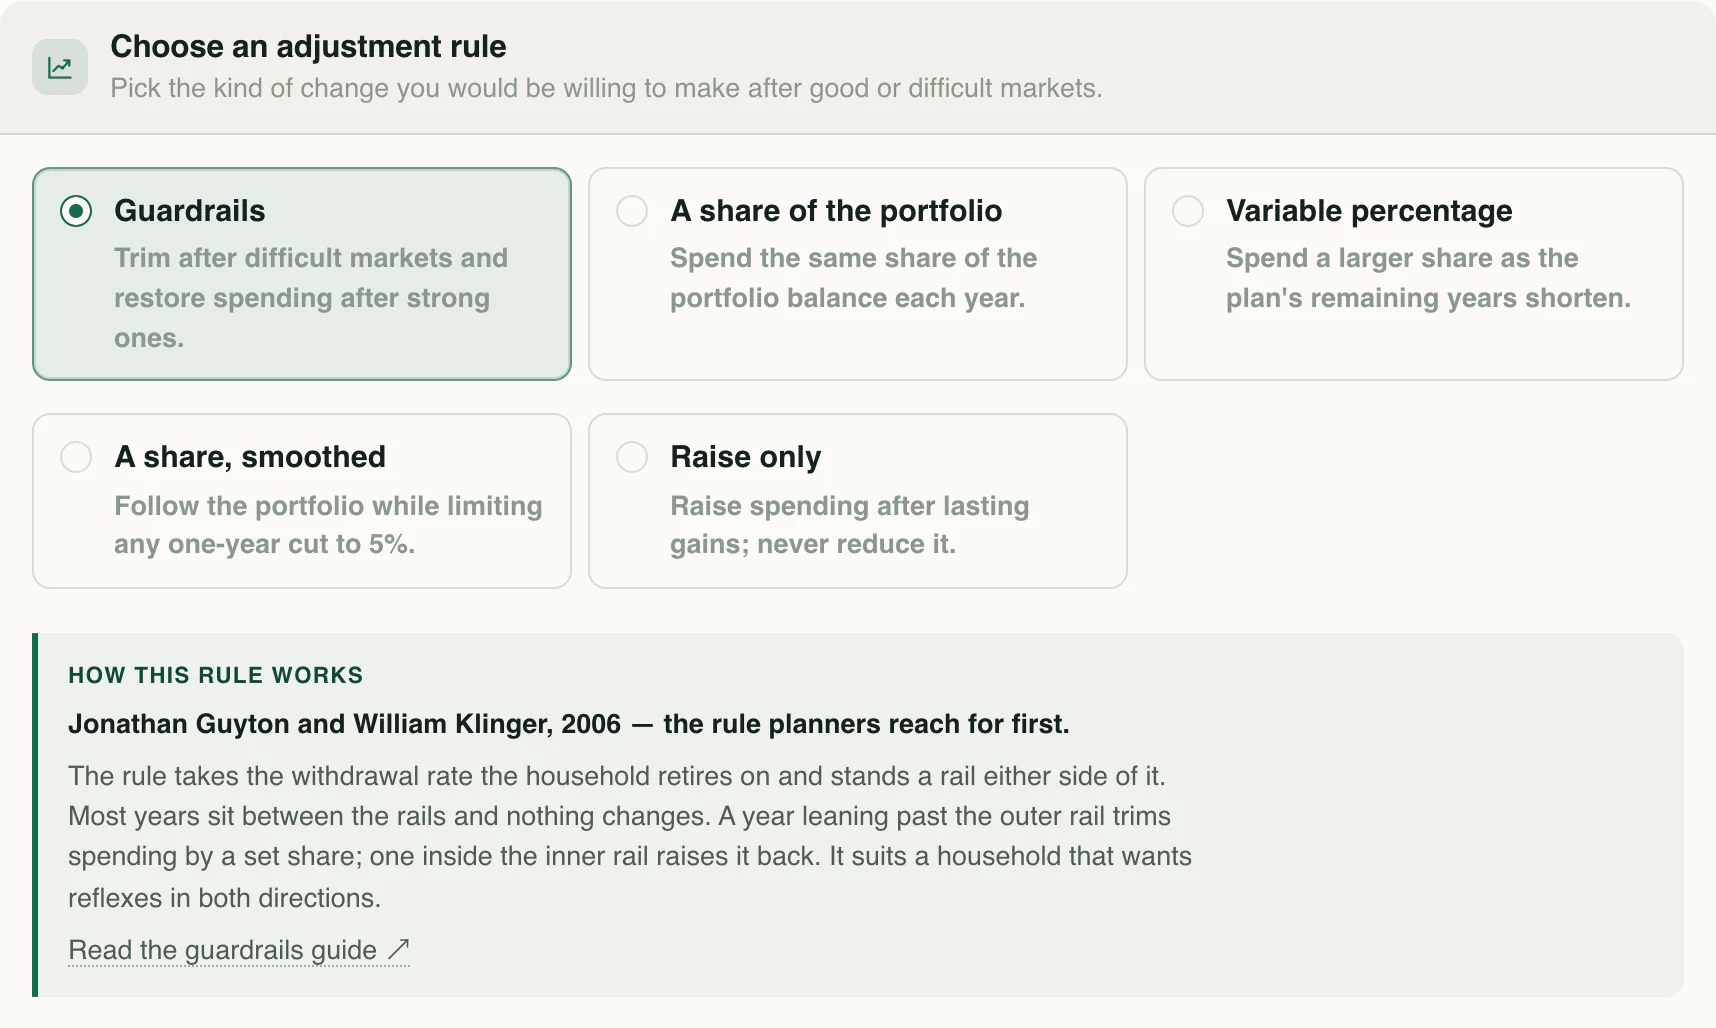
Compare retirement withdrawal strategies, including guardrails and variable percentage withdrawals, and see how spending responds to your portfolio.
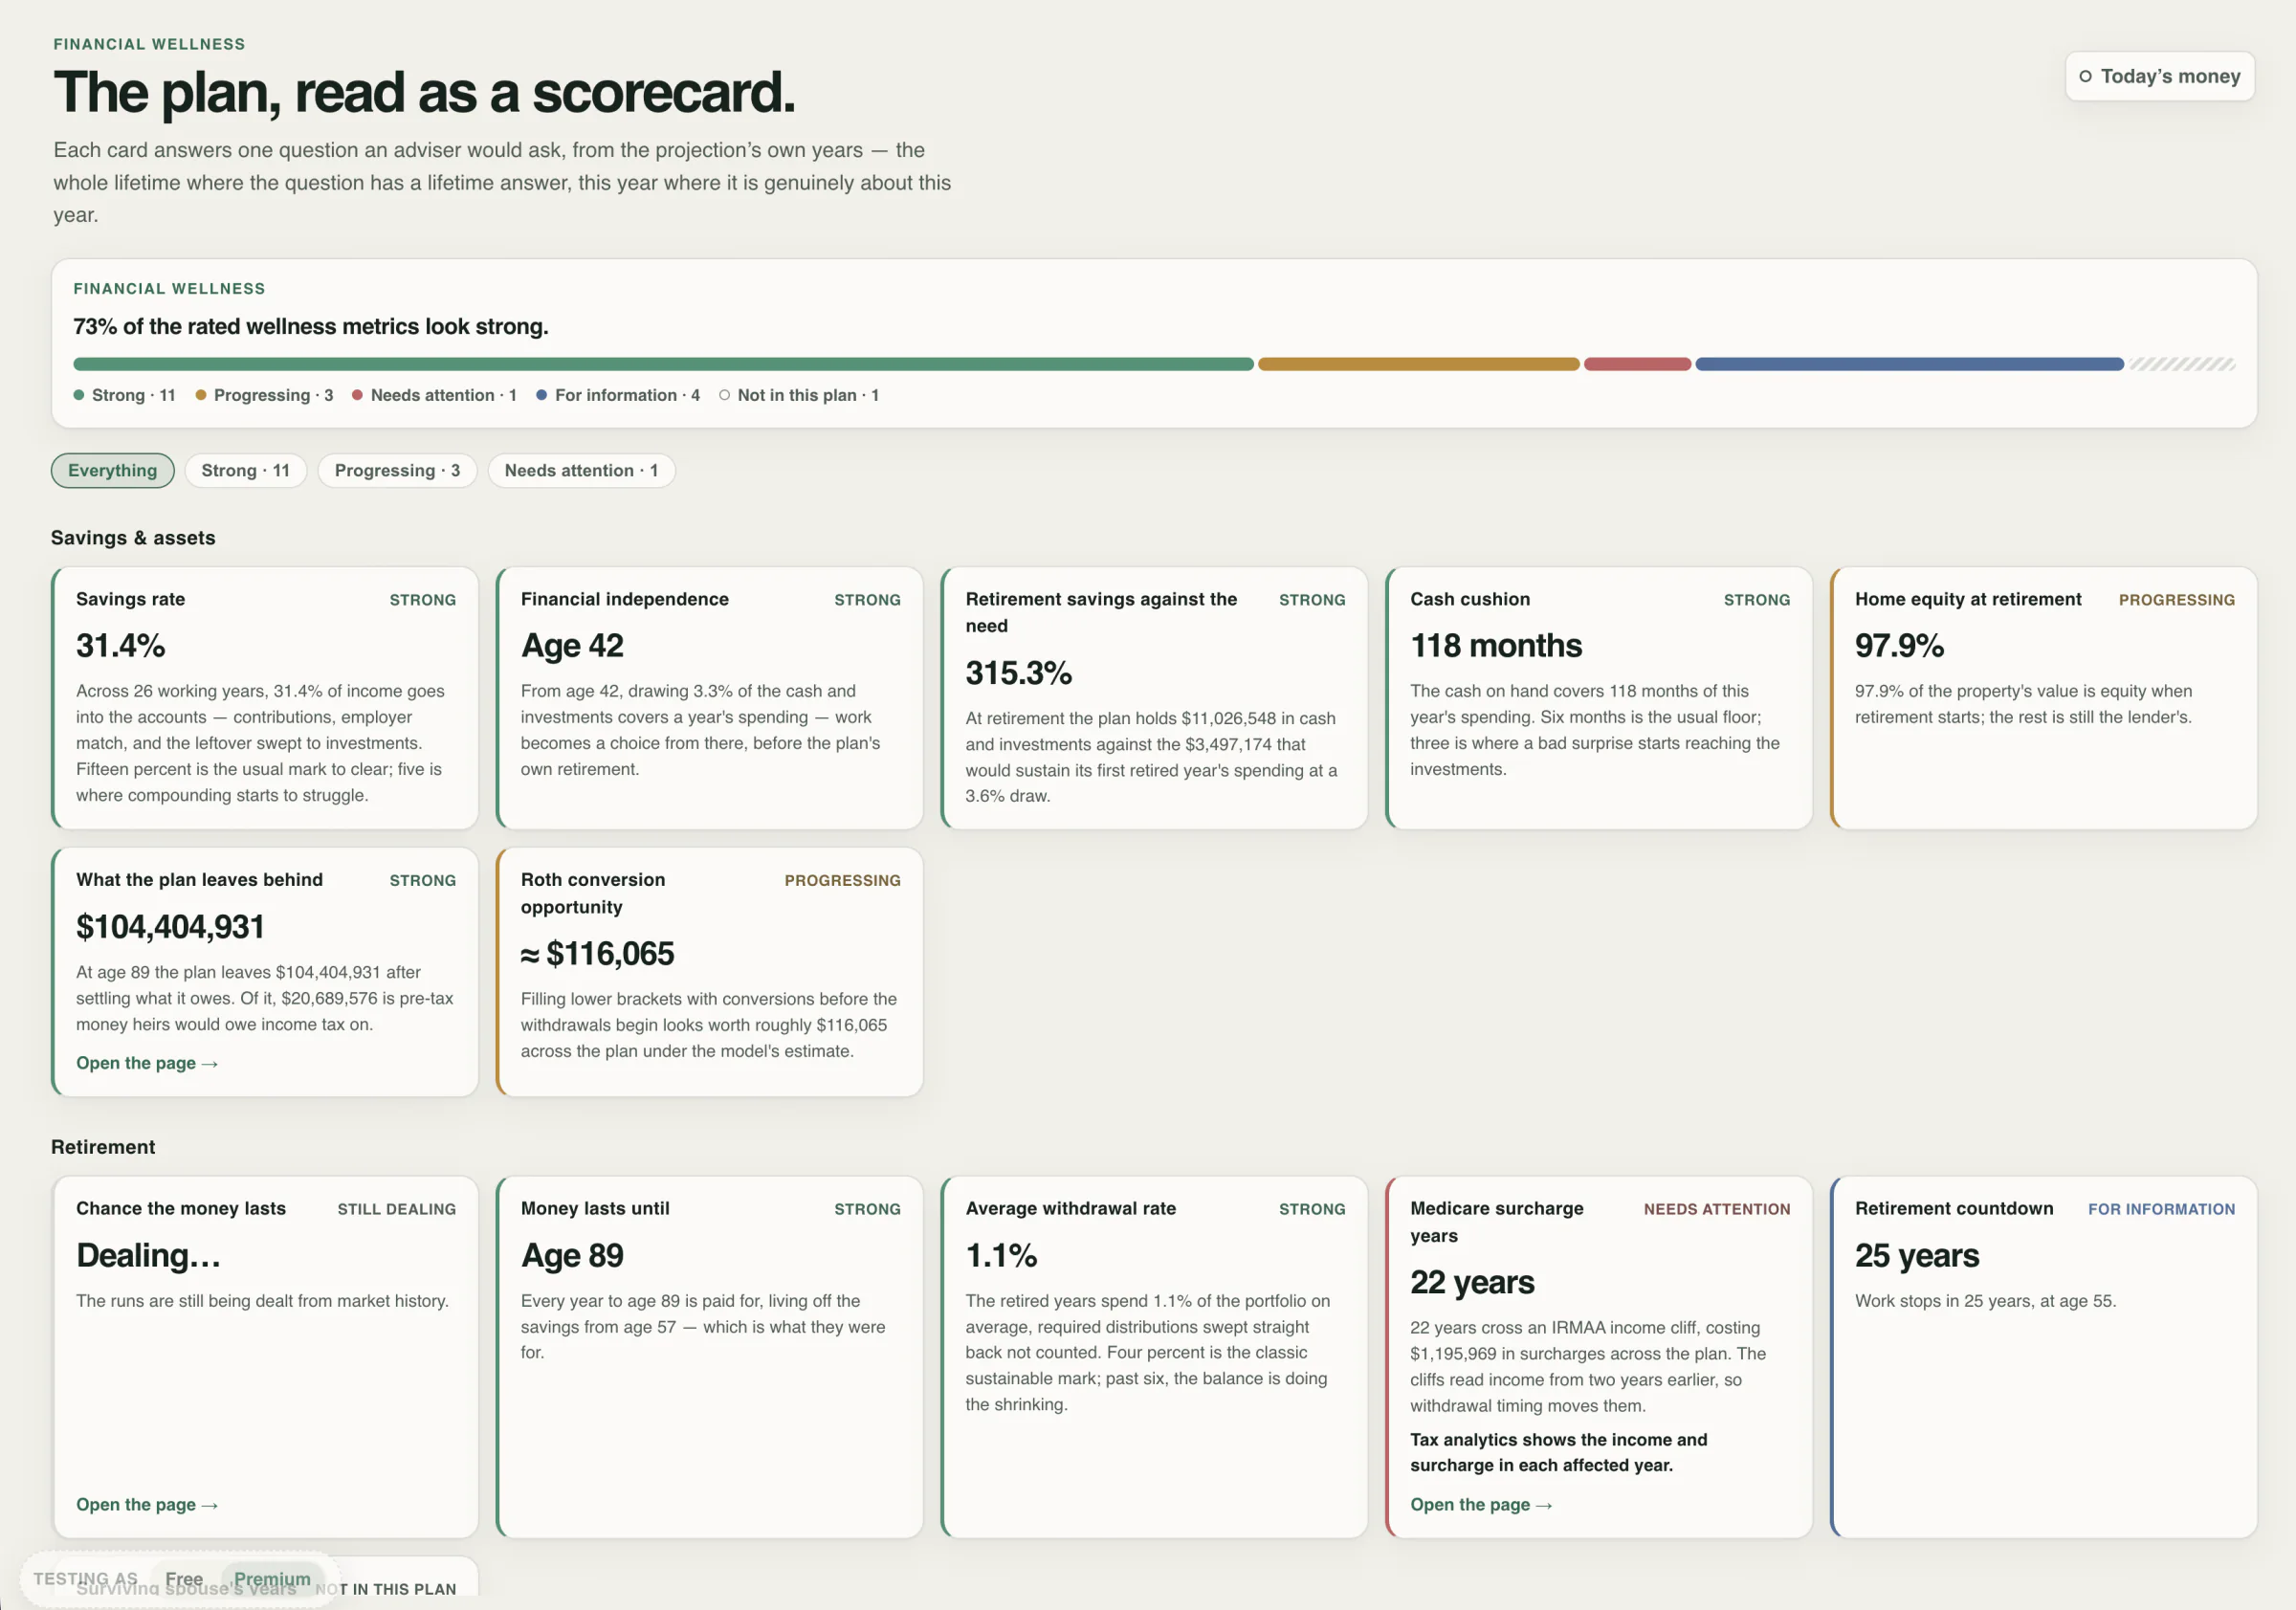
Read your forecast as a practical scorecard for savings, retirement readiness, and financial pressure points.
Know the language
Your next chapter
Start with your numbers. See where they could lead.