Replace the smooth line with history
Use actual annual index returns for market-following accounts instead of the same assumed return every year.
Historical market simulator
A smooth return assumption is only one view of the future. Replay historical market sequences and see how their timing affects your plan.
See what’s possible
Move a sequence into that part of your timeline and follow the consequences through withdrawals, spending, and recovery.
Read the detailed guideUse actual annual index returns for market-following accounts instead of the same assumed return every year.
Choose where a historical sequence begins in your plan and compare its effects at different life stages.
Replay major market downturns and inspect how your plan responds to the sequence of losses and recoveries.
Explore the details
The same return meets a different portfolio at different points in life. Contributions, education costs, and earlier withdrawals all change the balances exposed to a later market year. The Accounts view provides this context before you explore a historical sequence and inspect how it reshapes the plan.
From a question to a clearer picture
Market Simulator connects a real sequence of annual returns to a specific stretch of your plan. Both the historical starting year and its landing point are choices you control.
Open Market Simulator from the projection and select the eligible investment accounts that should follow the chosen index. Leave accounts outside the experiment on their configured assumptions. Cash keeps its own interest rate.
Choose the historical starting year and the plan year where it begins. Crisis shortcuts include 1929, 1973, 2000, and 2008; where the household retires within the plan, they place the start on its first retired year.
Inspect annual returns, withdrawals, taxes, and account balances through the difficult stretch and the years afterward. The full funding calculation responds, so a market change can affect cash needs, property sales, and the amount left later.
Connect the whole plan
A downturn matters differently when a household also needs to sell investments. The withdrawal view shows where those funding needs fall in the lifetime plan. Use it alongside the historical replay to investigate the years when market losses and living costs put pressure on the same balances.
One way to use it · illustrative scenario
Imagine a household with cash reserves, a brokerage account, and retirement savings. They want to explore how a difficult first year after work would interact with regular withdrawals.
Try an example planSelect the S&P 500 sequence beginning in 2008 and land it on the first retired plan year. Apply it to the investment accounts included in the experiment, keeping cash on its own rate.
Compare the first withdrawal years with the later recovery. Review whether income and available accounts fund the budget, which accounts are drawn down, and whether the plan reaches for property proceeds.
This exercise makes the timing of losses visible. It helps identify which assumptions to investigate next, such as retirement timing, cash reserves, or spending flexibility, without claiming that this historical path will happen again.
Make sense of what you see
Starting from chooses the historical year; Landing on chooses when those returns reach your household. Moving the landing changes the balances, contributions, and withdrawals that encounter the same market sequence.
Red and green bars show losses and gains as they occurred. The worst-year and drawdown readings describe the rough stretch; the annualized return summarizes the whole sequence but cannot explain its timing alone.
The dialog states where the historical data stops. Years before the landing and after coverage ends use each account’s configured return assumptions. The simulator does not keep repeating the historical sequence.
A little more detail
Every selected eligible account follows the same historical calendar years, so the shock reaches them together. Eligible accounts can be excluded, and cash accounts cannot follow the index.
A total-return series already includes reinvested distributions. For a price-only series, the model adds the account’s modeled equity yield. Account fees are deducted from either path.
Market Simulator replays one historical sequence in its original order. Plan resilience explores many rearranged histories. This replay uses annual returns and cash-flow timing, so it does not model trades or market swings within a year.
Keep exploring
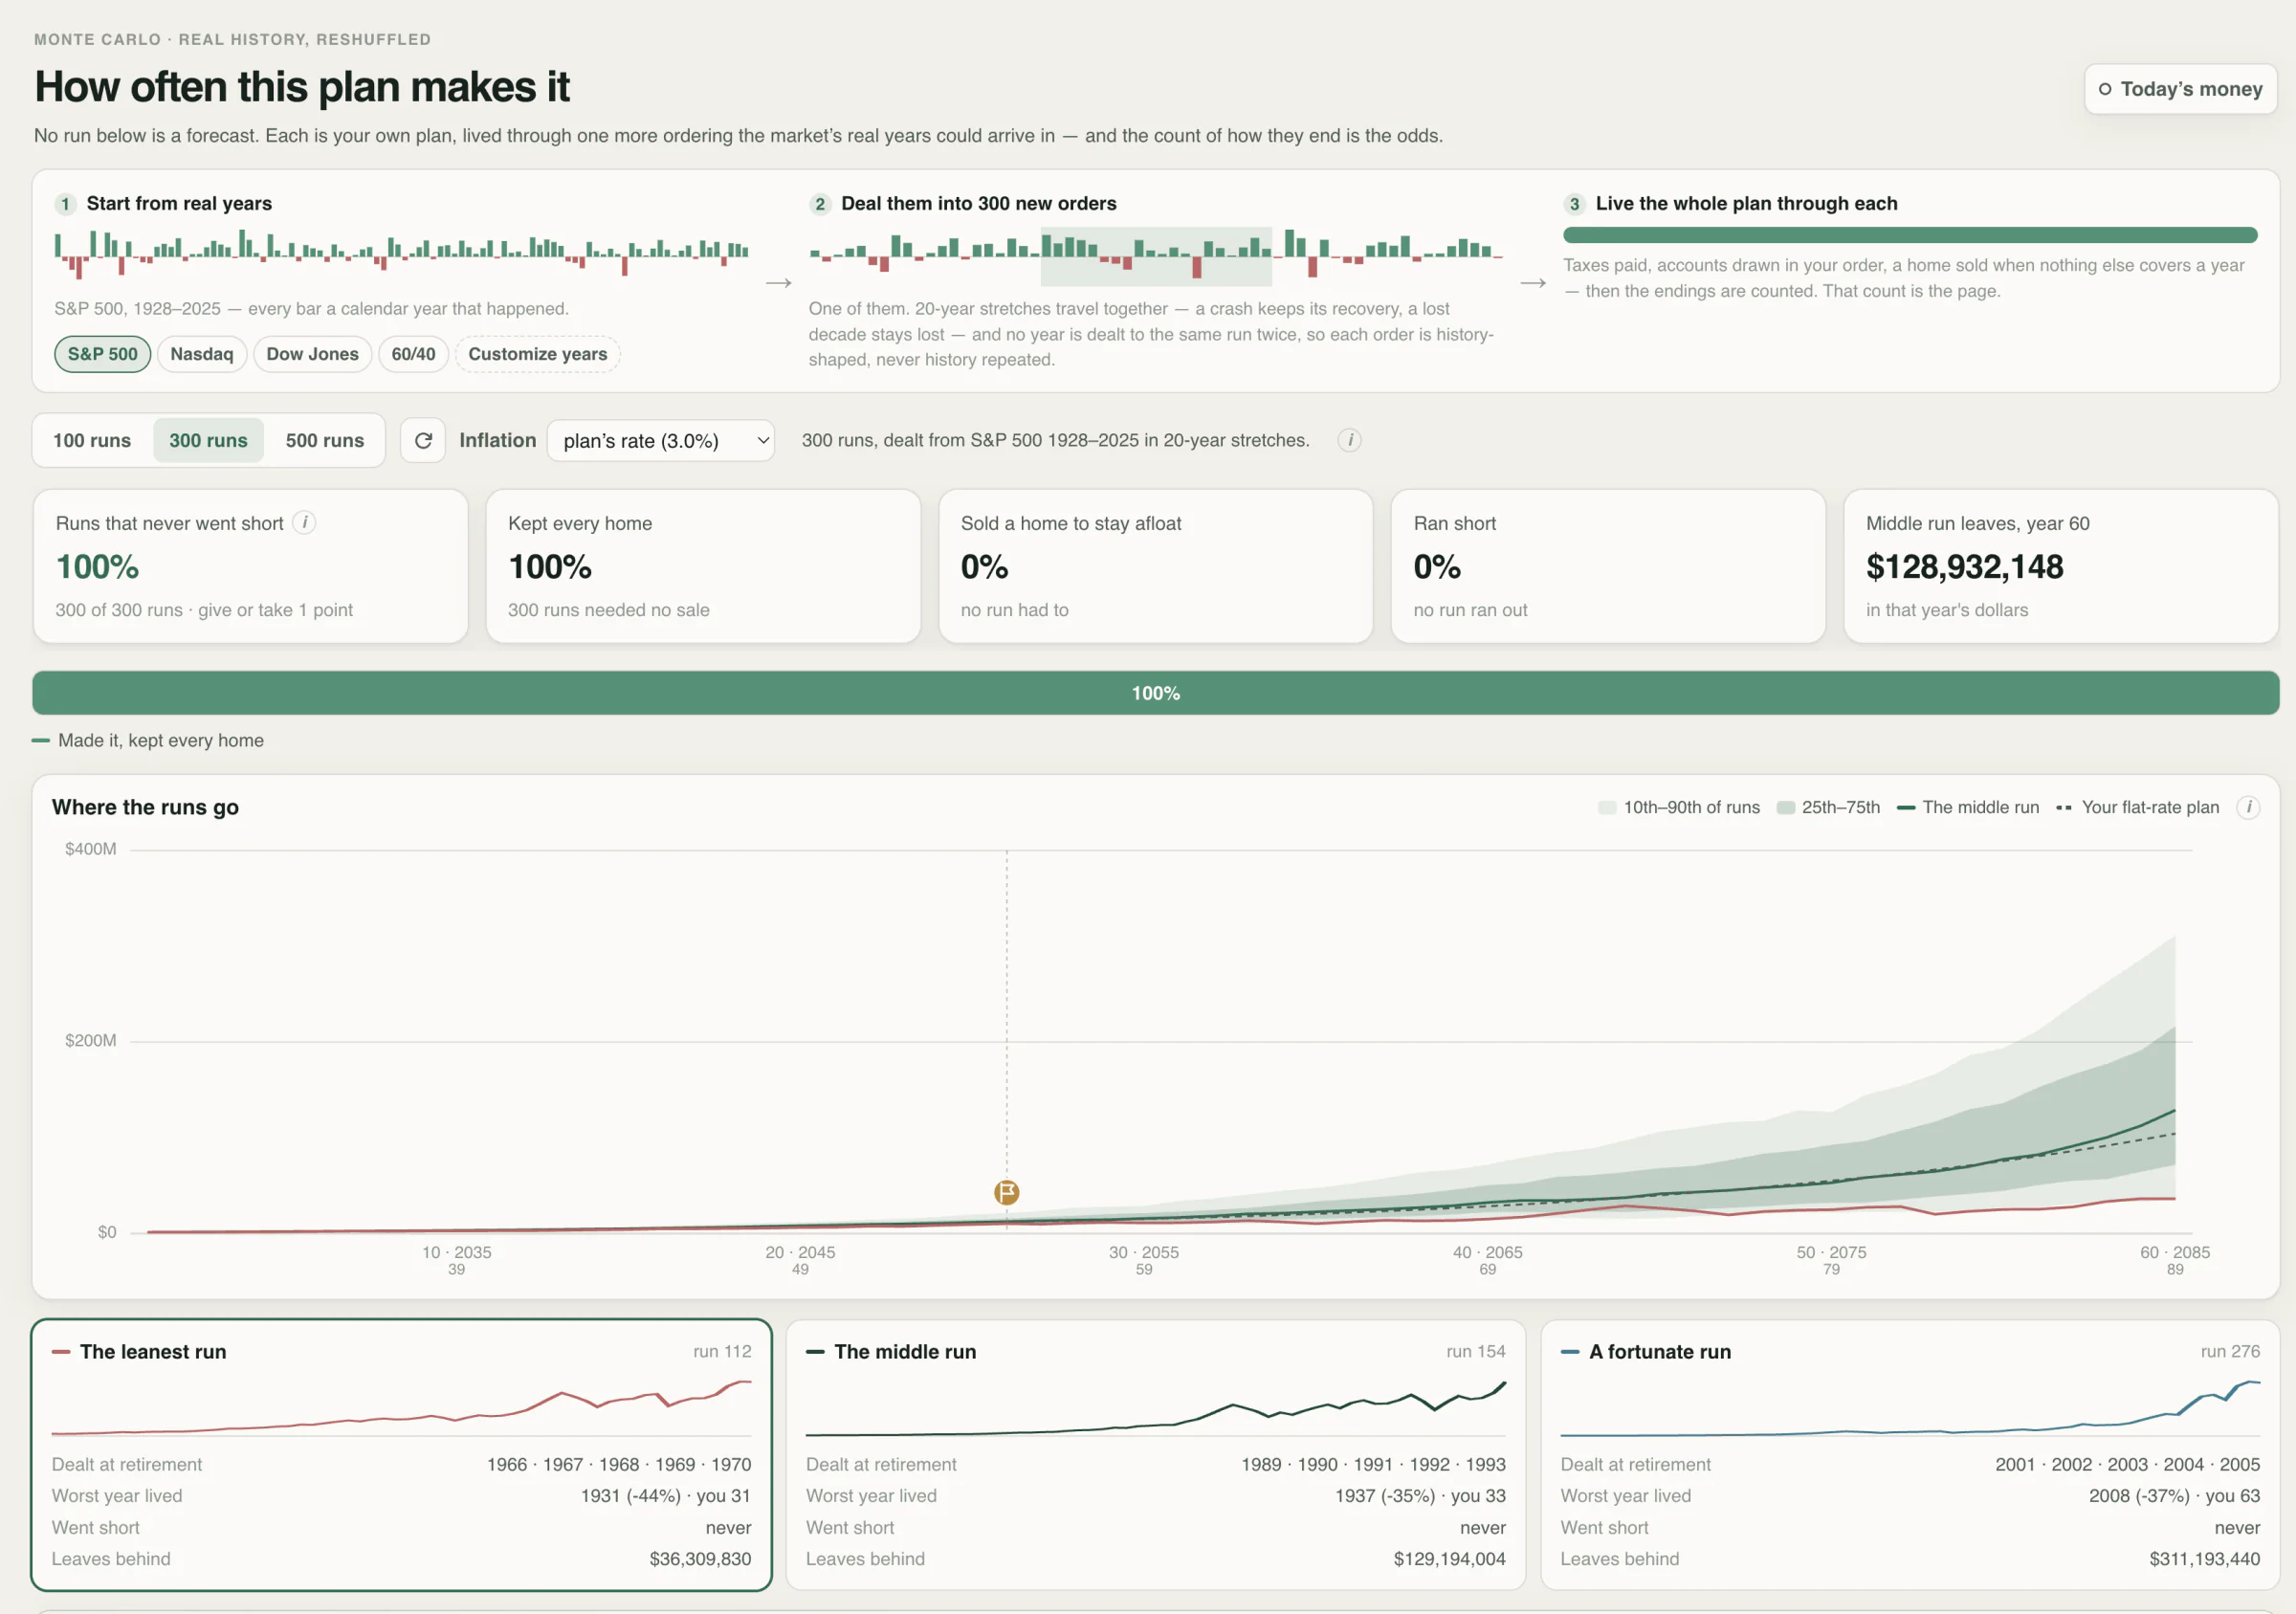
Stress-test your financial plan with historical market sequences and explore a range of possible outcomes.
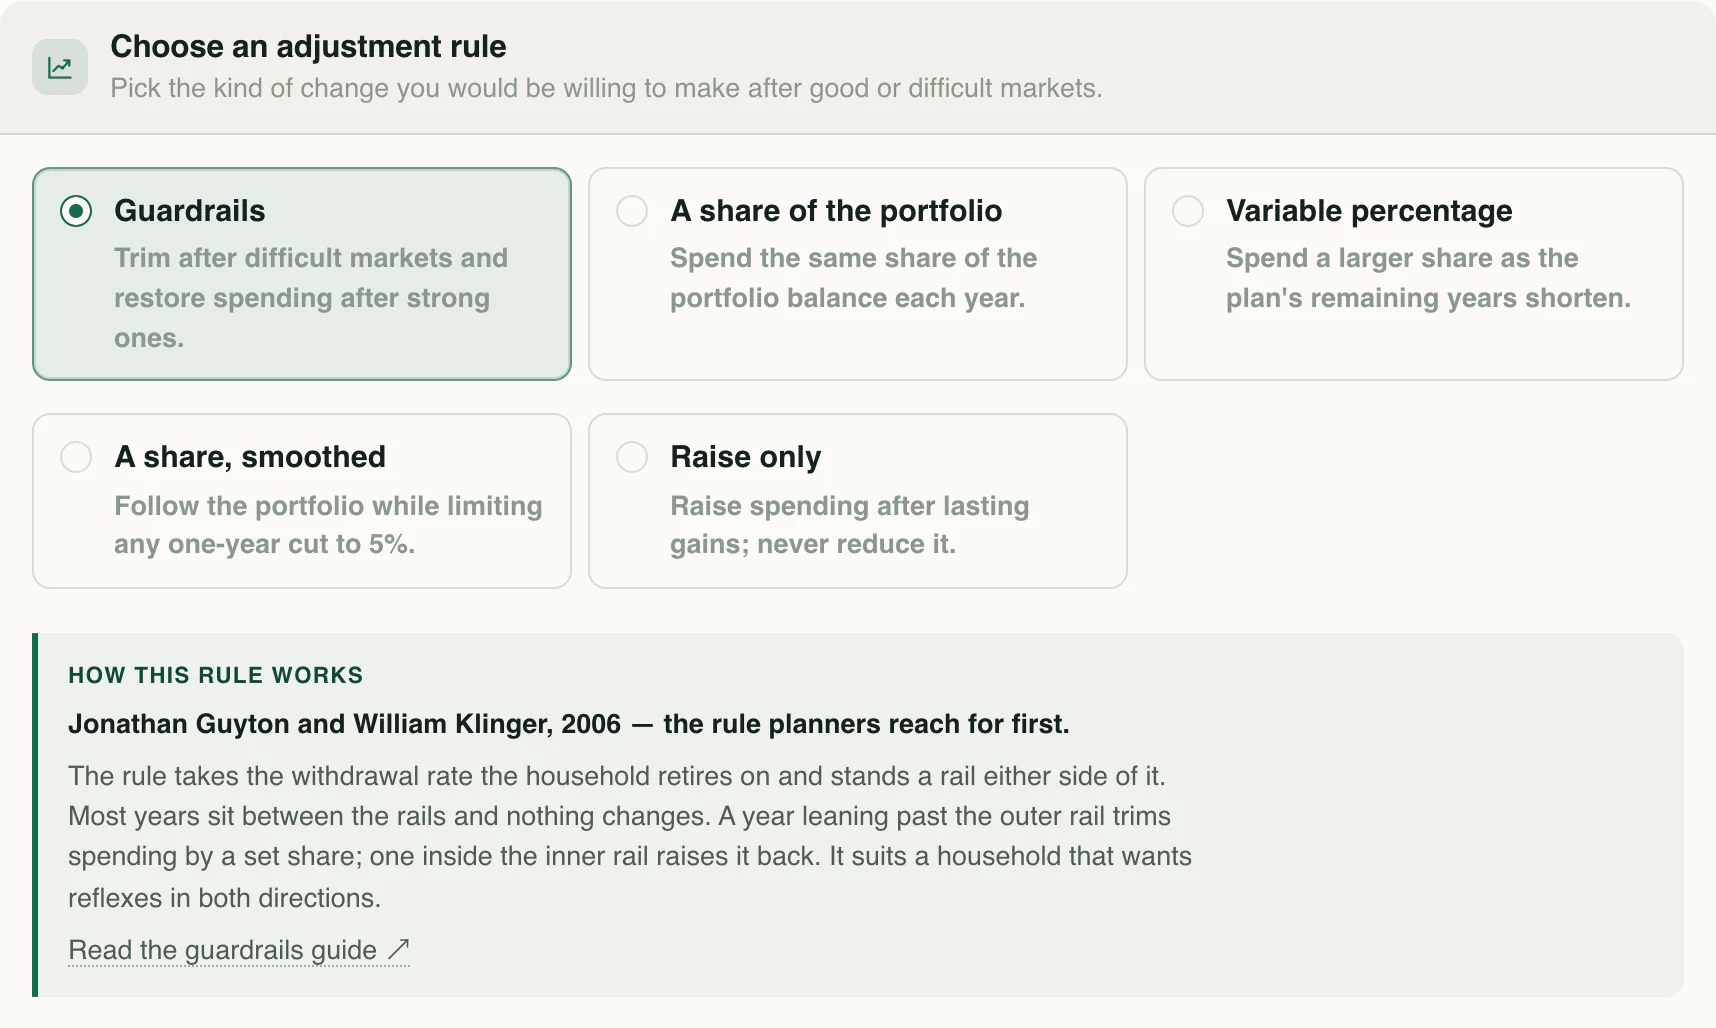
Compare retirement withdrawal strategies, including guardrails and variable percentage withdrawals, and see how spending responds to your portfolio.
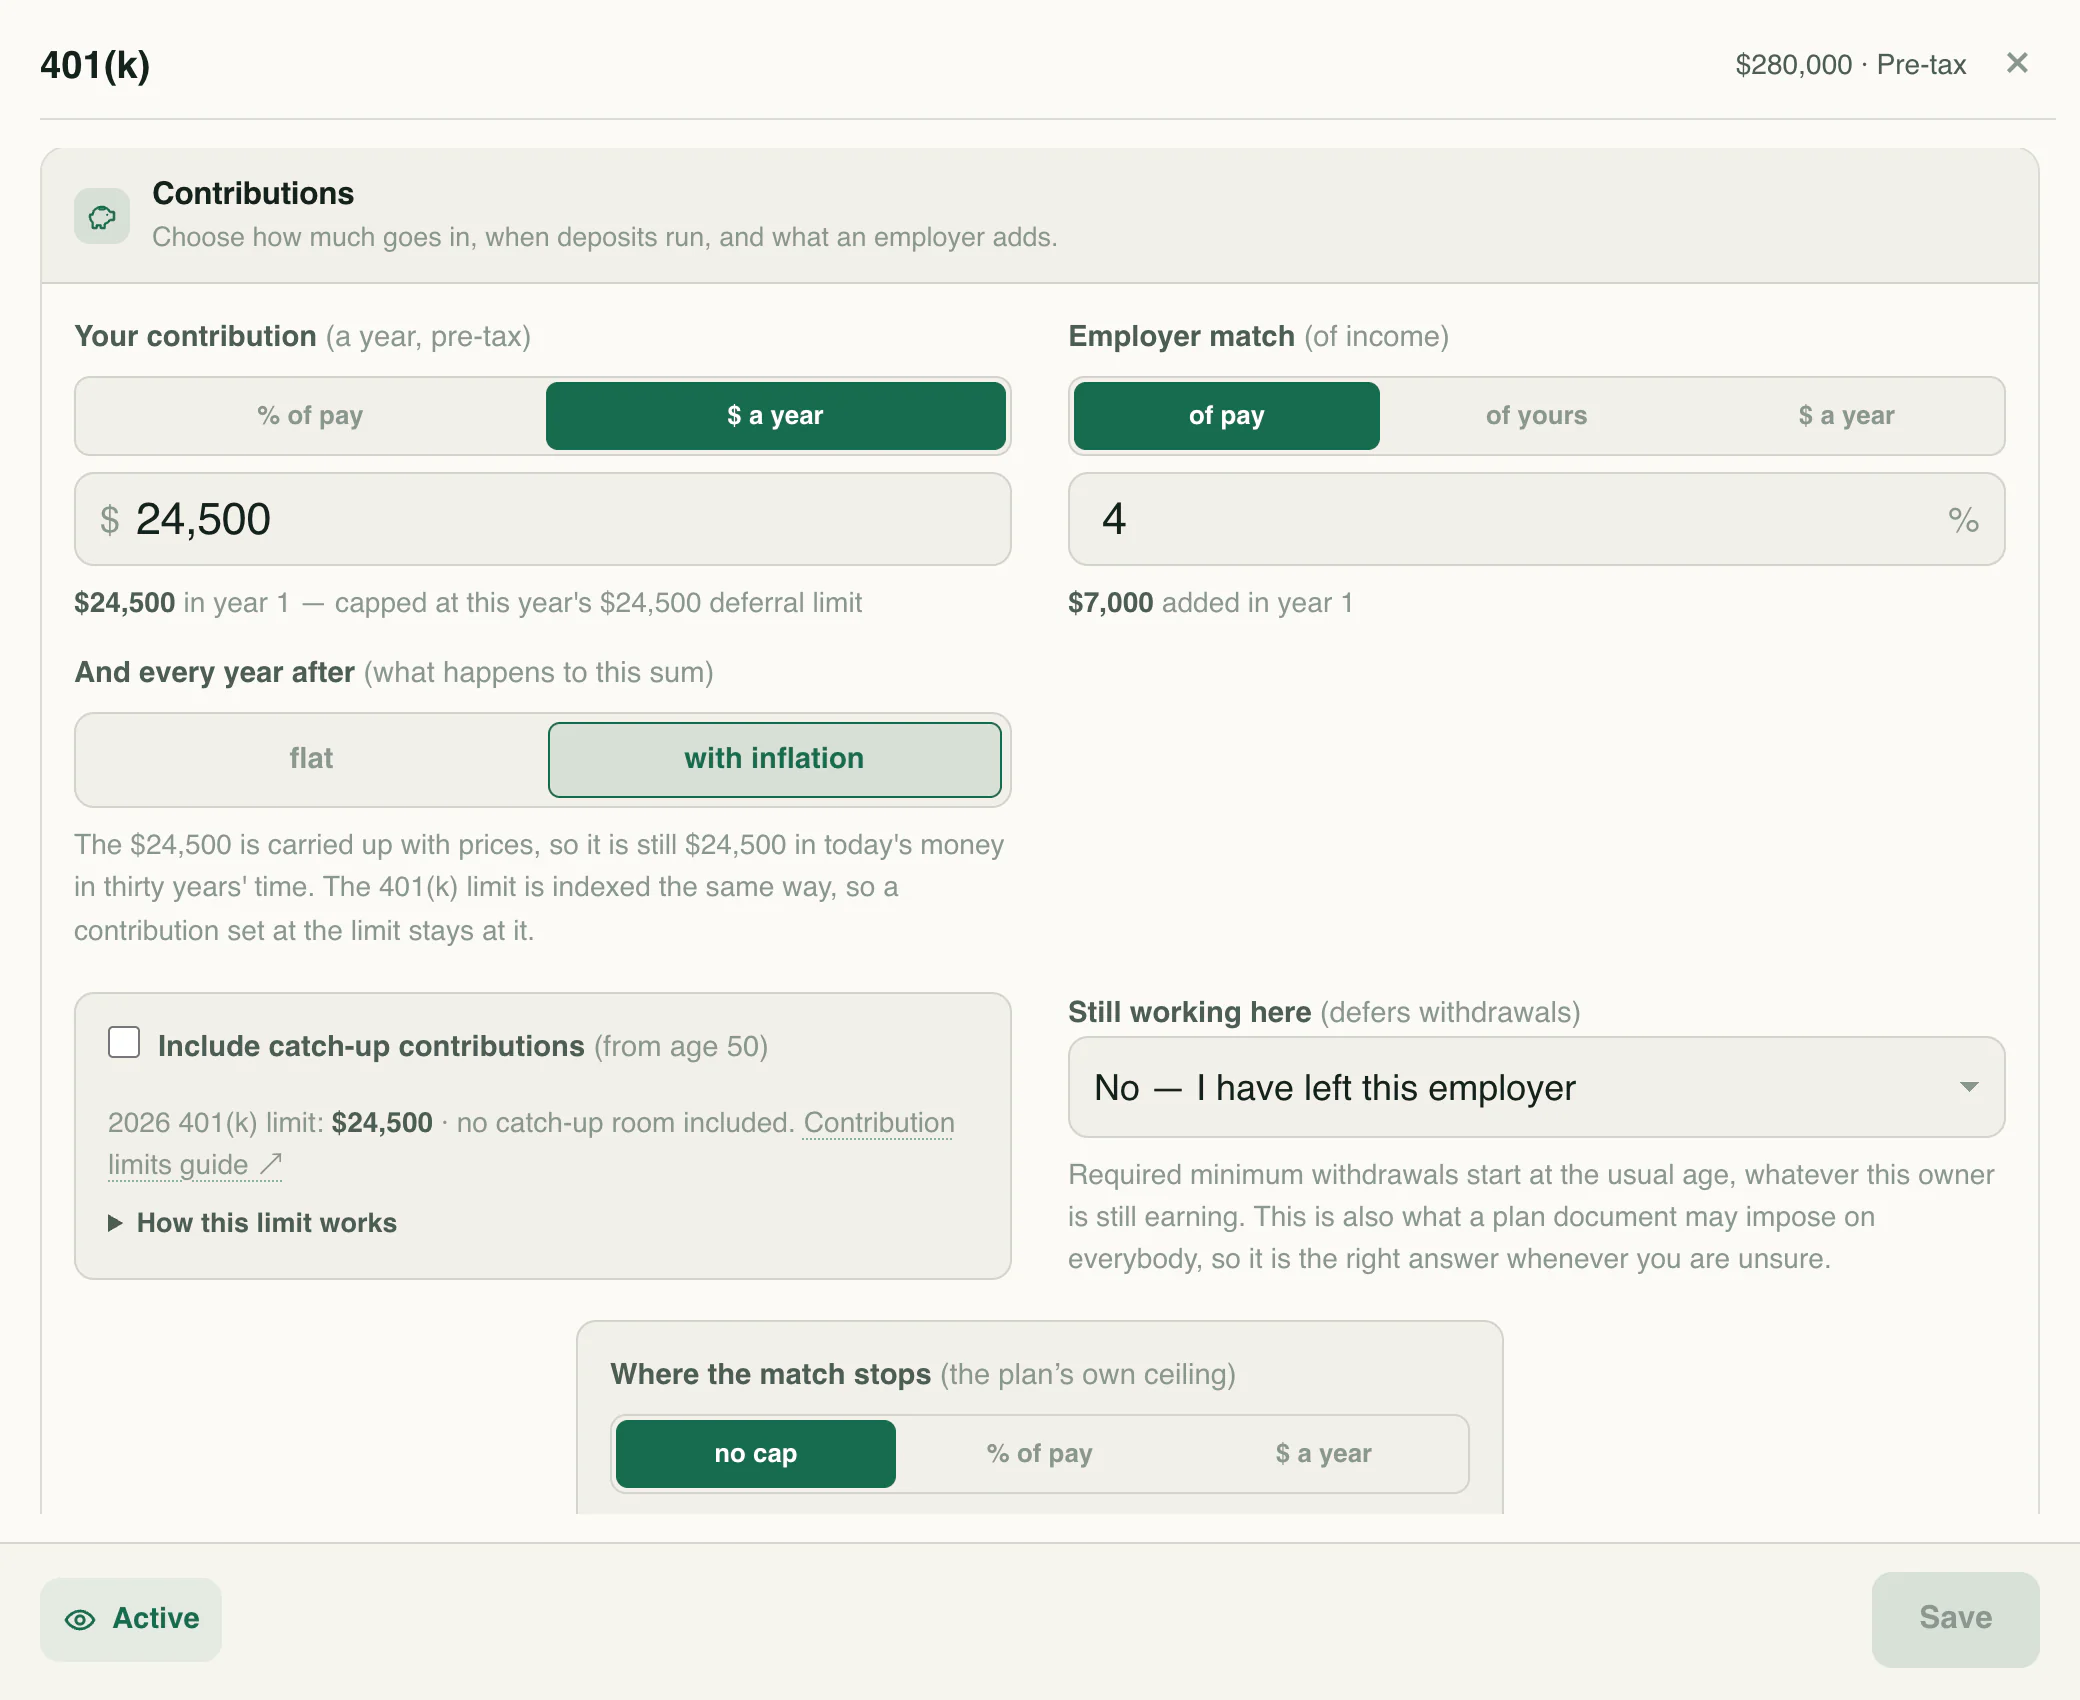
Explore retirement dates, 401(k) contributions, Social Security, and withdrawals with retirement planning software that connects saving to income after work.
Know the language
Your next chapter
Start with your numbers. See where they could lead.