See what makes up the bill
Explore modeled federal, state, local, payroll, and investment-related taxes across the planning horizon.
Tax analytics
Your income changes over a lifetime. Your estimated taxes do too. Explore the years, brackets, and sources behind the bill.
See what’s possible
Explore how retirement, investment income, and withdrawals change the tax picture before trying a different strategy.
Read the detailed guideExplore modeled federal, state, local, payroll, and investment-related taxes across the planning horizon.
Inspect bracket ladders, deductions, and tax worksheets to understand how the year’s inputs lead to its estimate.
Use the tax map to examine the modeled tax effect of additional ordinary income and identify changes in marginal rates.
Explore the details
Wages, investment income, employer contributions, conversions, and capital gains enter the calculation differently. The selected-year view shows gross income beside its attributed direct tax and effective source bands. It helps explain the bill’s composition while keeping these effective rates distinct from statutory marginal tax brackets.
From a question to a clearer picture
Start with the lifetime pattern, then narrow the view to the year and source of income you want to understand.
Review household filing status, location, income streams, and account types in your plan. Include account ownership and cost basis where relevant. These details help the projection distinguish wages, retirement withdrawals, investment gains, and the other amounts that shape a year's tax picture.
Open Tax analytics and select a bar in the lifetime chart. Use the selected-year breakdown to see which taxes contribute to the total. Continue to the bracket ladders and worksheets when you want to follow taxable income through the calculation.
Use the tax map to explore the modeled cost of additional ordinary income in that year. If the pattern raises a planning question, try a change in What-If or Tax Planning, then return to inspect how the affected years and lifetime totals move.
Connect the whole plan
A lower tax bill in one year does not by itself describe the best outcome over a lifetime. Conversion analysis connects an added tax cost today with later withdrawals and ending balances. Move between these views to understand both the annual calculation and the longer trade-off being modeled.
One way to use it · illustrative scenario
Imagine a household planning to leave work before its larger retirement-account withdrawals begin. It wants to understand the tax pattern across that transition.
Try an example planCreate a hypothetical earlier retirement date while keeping the rest of the plan's assumptions consistent.
Compare the last working year, the first retired year, and a later withdrawal year. Look at taxable income, the tax categories, and where ordinary income lands on the bracket ladder.
The comparison reveals which years deserve further exploration. A lower annual bill alone does not establish that the whole financial plan improved.
Make sense of what you see
The stacked bars show estimated tax amounts by category. The effective-rate line expresses a rate. Read their separate axes: a taller tax bar can coexist with a lower effective rate when the underlying income changes.
The selected-year panel explains the highlighted bar. Check its year before comparing the total, taxable income, or individual taxes with another screen. Moving the selection changes the question from a lifetime pattern to one annual calculation.
Today's money expresses future amounts in current purchasing power; the alternative displays future dollars. Use the same setting across comparisons so inflation does not look like a change in the strategy's effect.
A little more detail
No. The effective rate summarizes the modeled year. The marginal bracket describes the last slice of taxable income, while the tax map explores interactions when more ordinary income is added. That map prices conversions and withdrawals; a wage increase would add payroll tax beyond the displayed curve.
The page reads the projection's calculations. Change the relevant household, income, investment, property, or tax-planning assumption in the plan, then inspect the resulting estimate here. Selecting a year changes the view rather than the underlying plan.
It is a scenario view using the product's documented annual tax model. Coverage and assumptions matter, and future rules can differ. Use the worksheets to understand the estimate and the methodology to check what the model includes.
Keep exploring
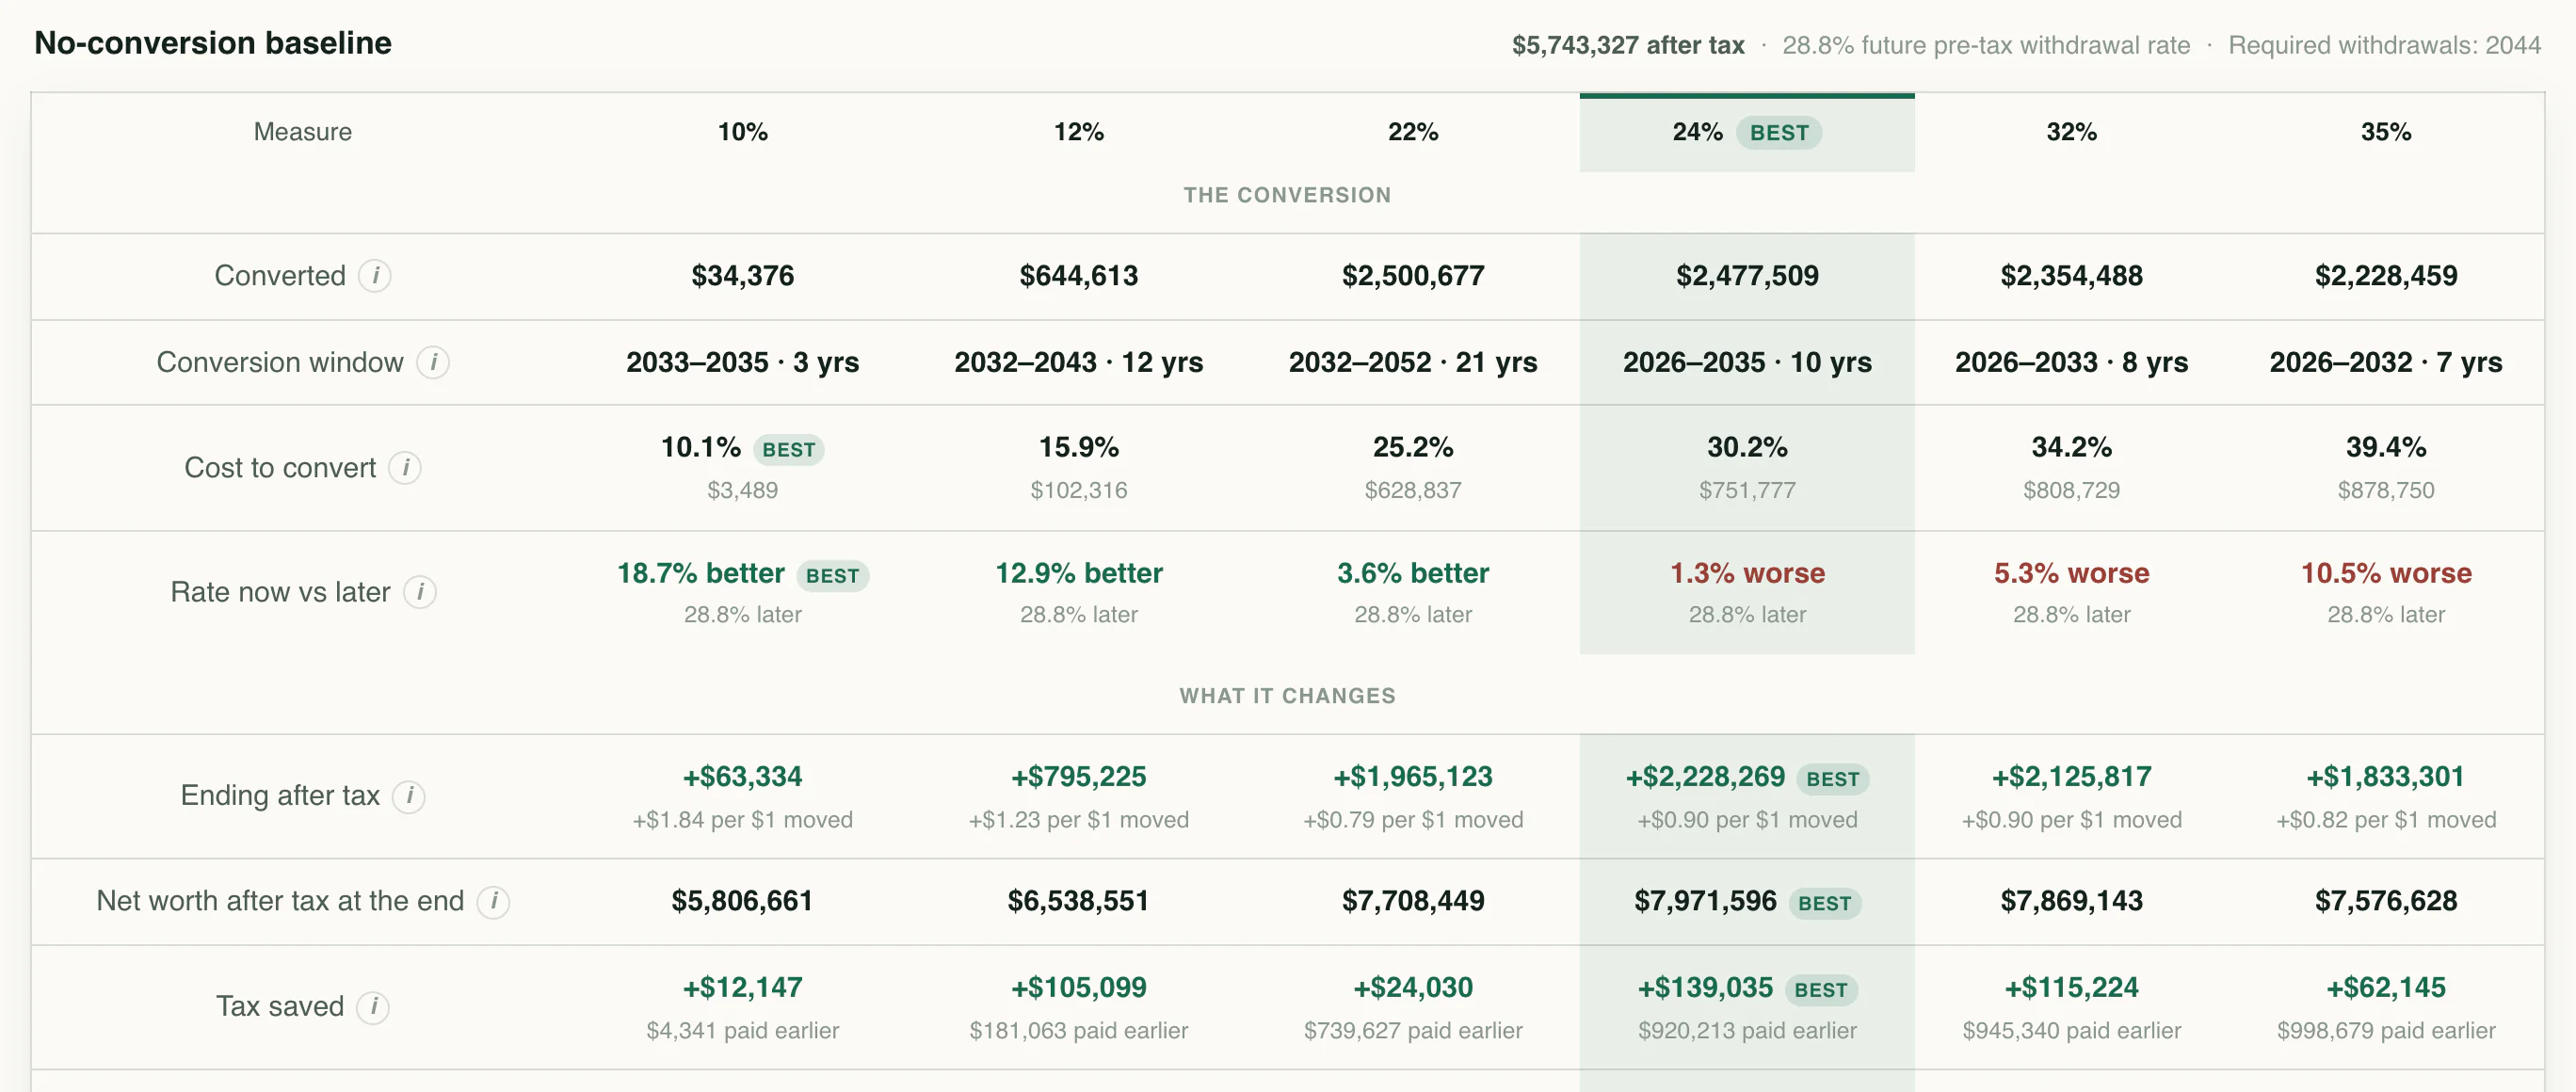
Compare conversion strategies and see the trade-offs between taxes today, later withdrawals, and ending wealth.
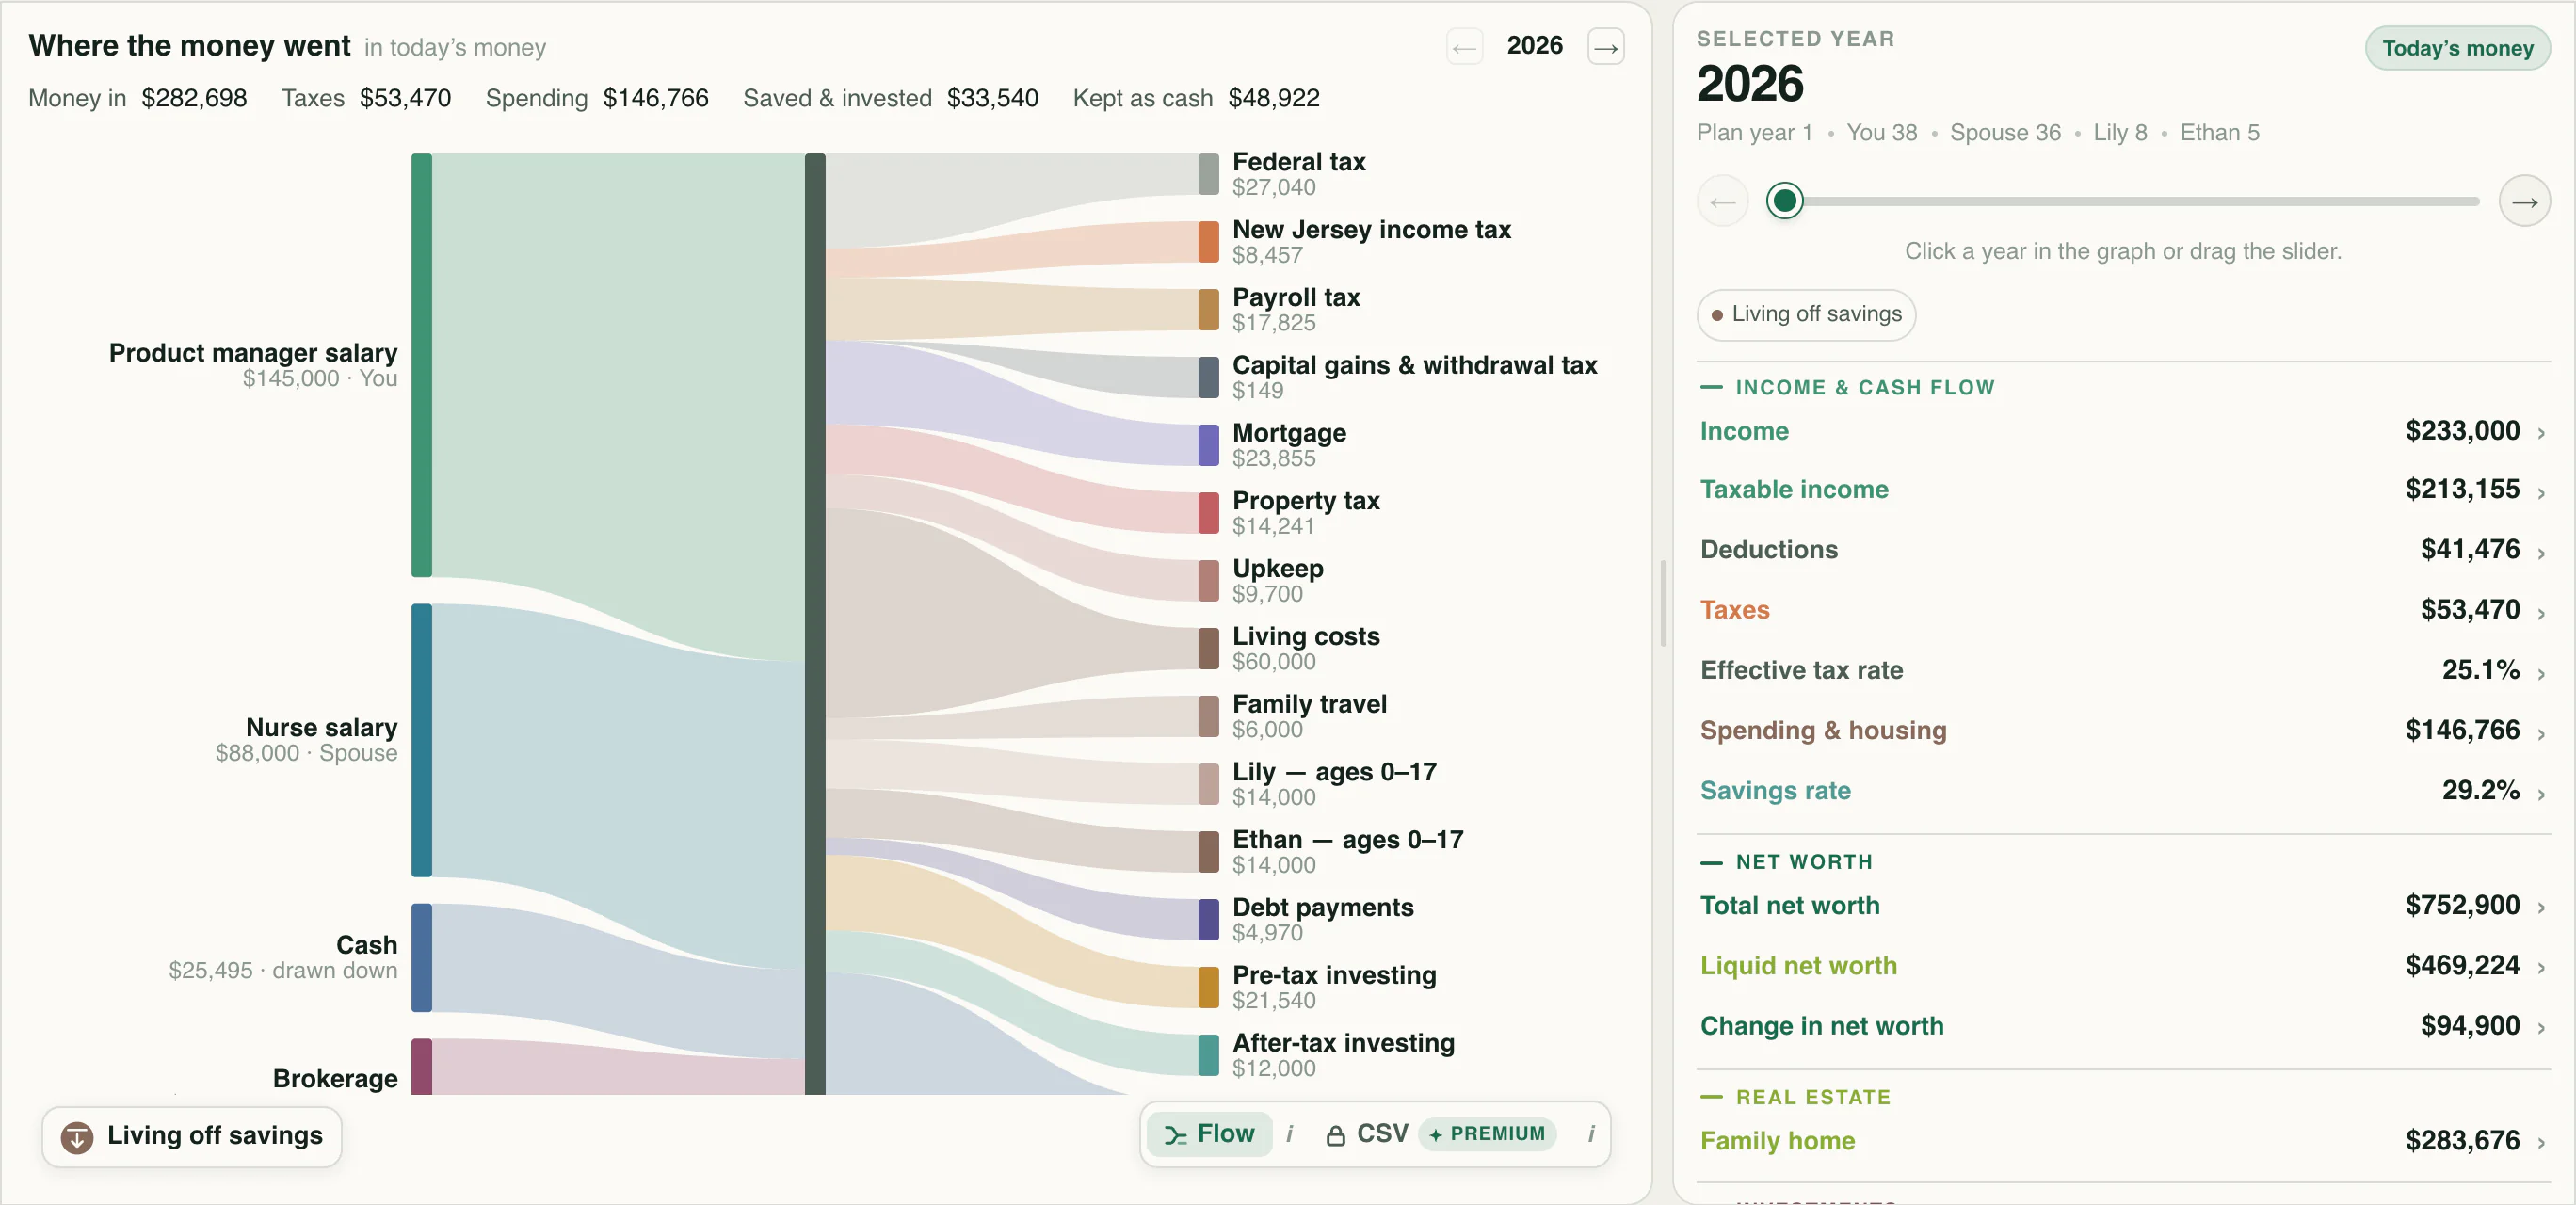
Plan household cash flow across working years and retirement. Trace income into taxes, living costs, investments, and the cash you keep.
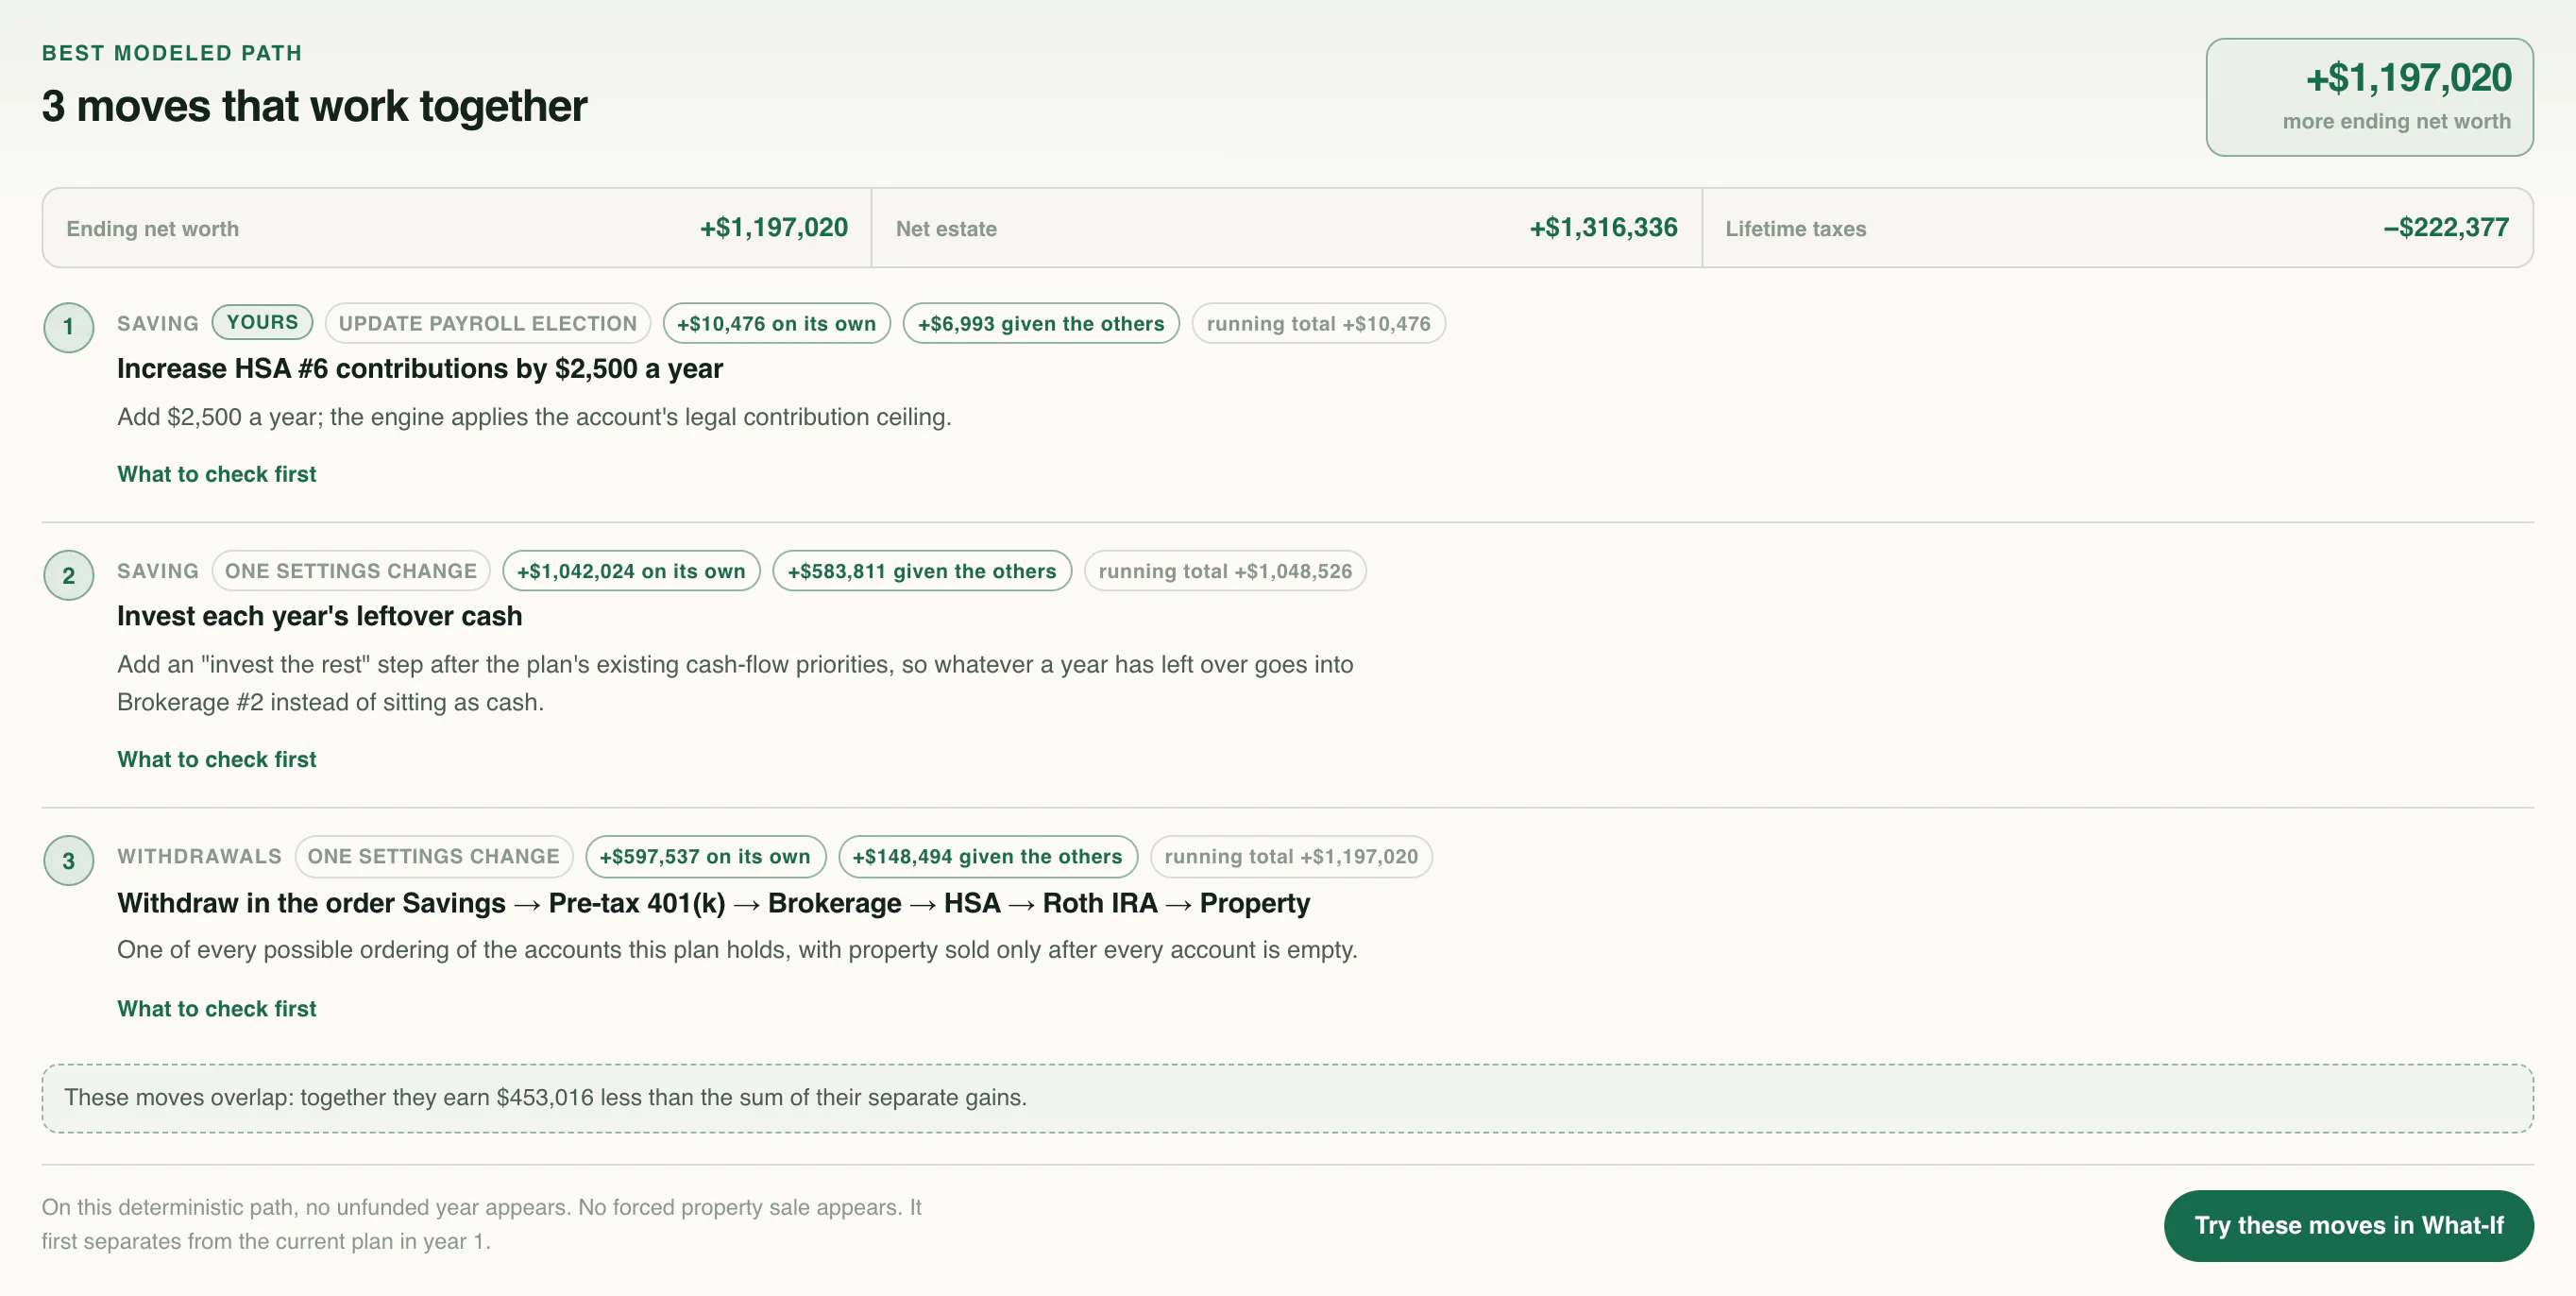
Test combinations of saving, spending, investing, property, and tax choices against the outcome you choose.
Know the language
Your next chapter
Start with your numbers. See where they could lead.