Get a readable overview
Preview charts, milestones, and annual tables from the plan you’re working on.
Financial reports & exports
Read your plan as a clear report, then bring the detail into a conversation or your own analysis with downloadable summaries and tables.
See what’s possible
Bring the forecast, its milestones, and the annual details together in a format you can review with someone else.
Read the detailed guidePreview charts, milestones, and annual tables from the plan you’re working on.
Download a PDF report to review and discuss your financial picture away from the app.
Export cash flow, net worth, portfolio, tax schedules, and the annual ledger as CSV for further analysis.
Explore the details
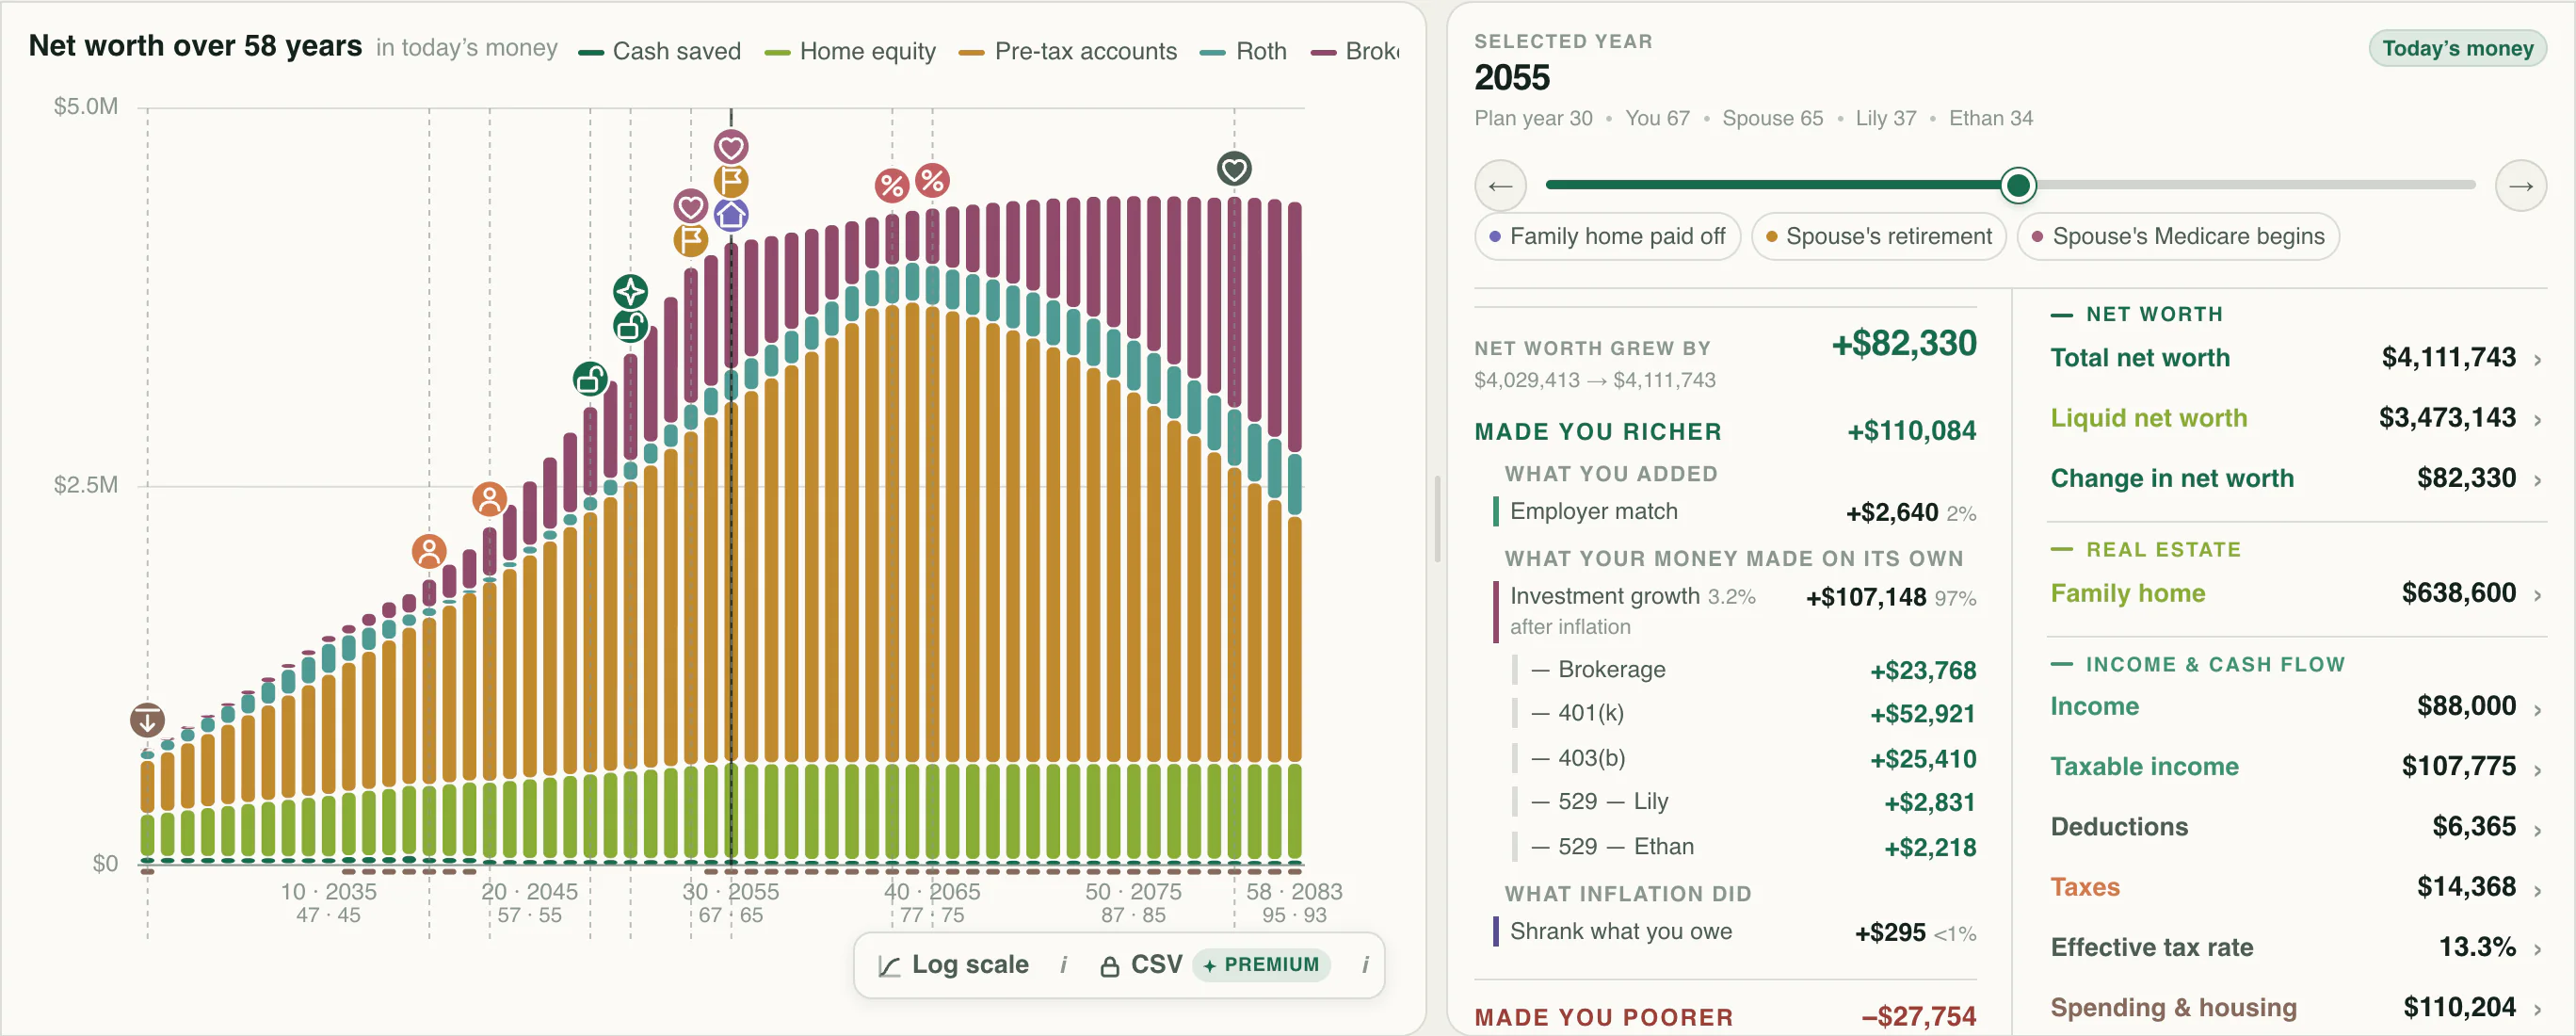
A table becomes easier to interpret when you can locate the same pattern in the forecast. The net-worth chart provides a visual reference for milestone years and changes in the balance. Keep the household, plan, and money basis consistent when moving between that view and a report.
From a question to a clearer picture
Choose the report that answers your next question. Each preview reads the same projected years as the workspace, with context that travels into the downloaded file.
Open the plan you want to discuss and review its assumptions. Choose future dollars or Today’s money before exporting. The chosen basis appears in the preview, on the PDF, and in the CSV context lines.
Choose the financial plan summary or a topic report: income and cash flow, net worth and liquidity, portfolio and withdrawals, or lifetime taxes. The complete annual ledger brings the detailed yearly figures together. Inspect the headlines, graph, and table.
Download the PDF summary for reading and discussion, or CSV files for your own spreadsheet analysis. Files carry the plan name and money basis so an exported scenario can be identified later.
Connect the whole plan
A tax table records the numbers; the selected-year breakdown explains their composition. Review the income sources and attributed tax before carrying the figures into a spreadsheet or discussion. That context makes it easier to ask a precise question about the forecast and return to the relevant assumptions.
One way to use it · illustrative scenario
Imagine a household preparing to discuss a move to part-time work. Their plan already includes the proposed income change, spending assumptions, and the accounts expected to cover the gap.
Try an example planChoose Today’s money and preview the financial plan summary. Then open Portfolio & withdrawals and Lifetime tax schedule to focus the review on the years after the income change.
Pin those years on the report graphs and read the annual tables. Look for the accounts supplying withdrawals, the estimated taxes, and the relationship between headline net worth and accessible wealth.
The report gives the conversation a common set of assumptions and specific years to discuss. If the discussion changes a choice, edit the plan first and generate a fresh report from the revised forecast.
Make sense of what you see
The report screenshot follows household net worth through the plan. Compare its path with the other lines to see why a single headline balance may not describe the money available to use.
The liquid-worth line keeps cash and investment accounts separate from property. Compare it with after-tax worth and the withdrawal detail to understand the tax exposure and account rules that also affect money available for spending.
This line estimates net worth after the tax from realizing balances and gains in that year. It is a liquidation scenario used to show tax exposure; it is not an extra bill deducted from the ordinary projection.
A little more detail
The PDF includes the overview, assumptions, headline results, charts, balance-sheet snapshots, income and spending breakdowns, milestones, and an annual projection. A resilience section appears when applicable; sections with no meaningful data are omitted.
Yes. CSV exports contain a row for each plan year with calendar years and household ages. Some columns appear only in the files, so download the relevant topic report or complete annual ledger when you need fuller detail.
No. Taxes are calculated on each year’s actual projected dollars. Today’s money converts the finished figures into purchasing power using the plan’s inflation assumptions, or the selected historical run’s inflation when viewing a run.
Keep exploring
Financial planning software to project income, spending, taxes, investments, and net worth year by year, then compare the choices that shape your future.
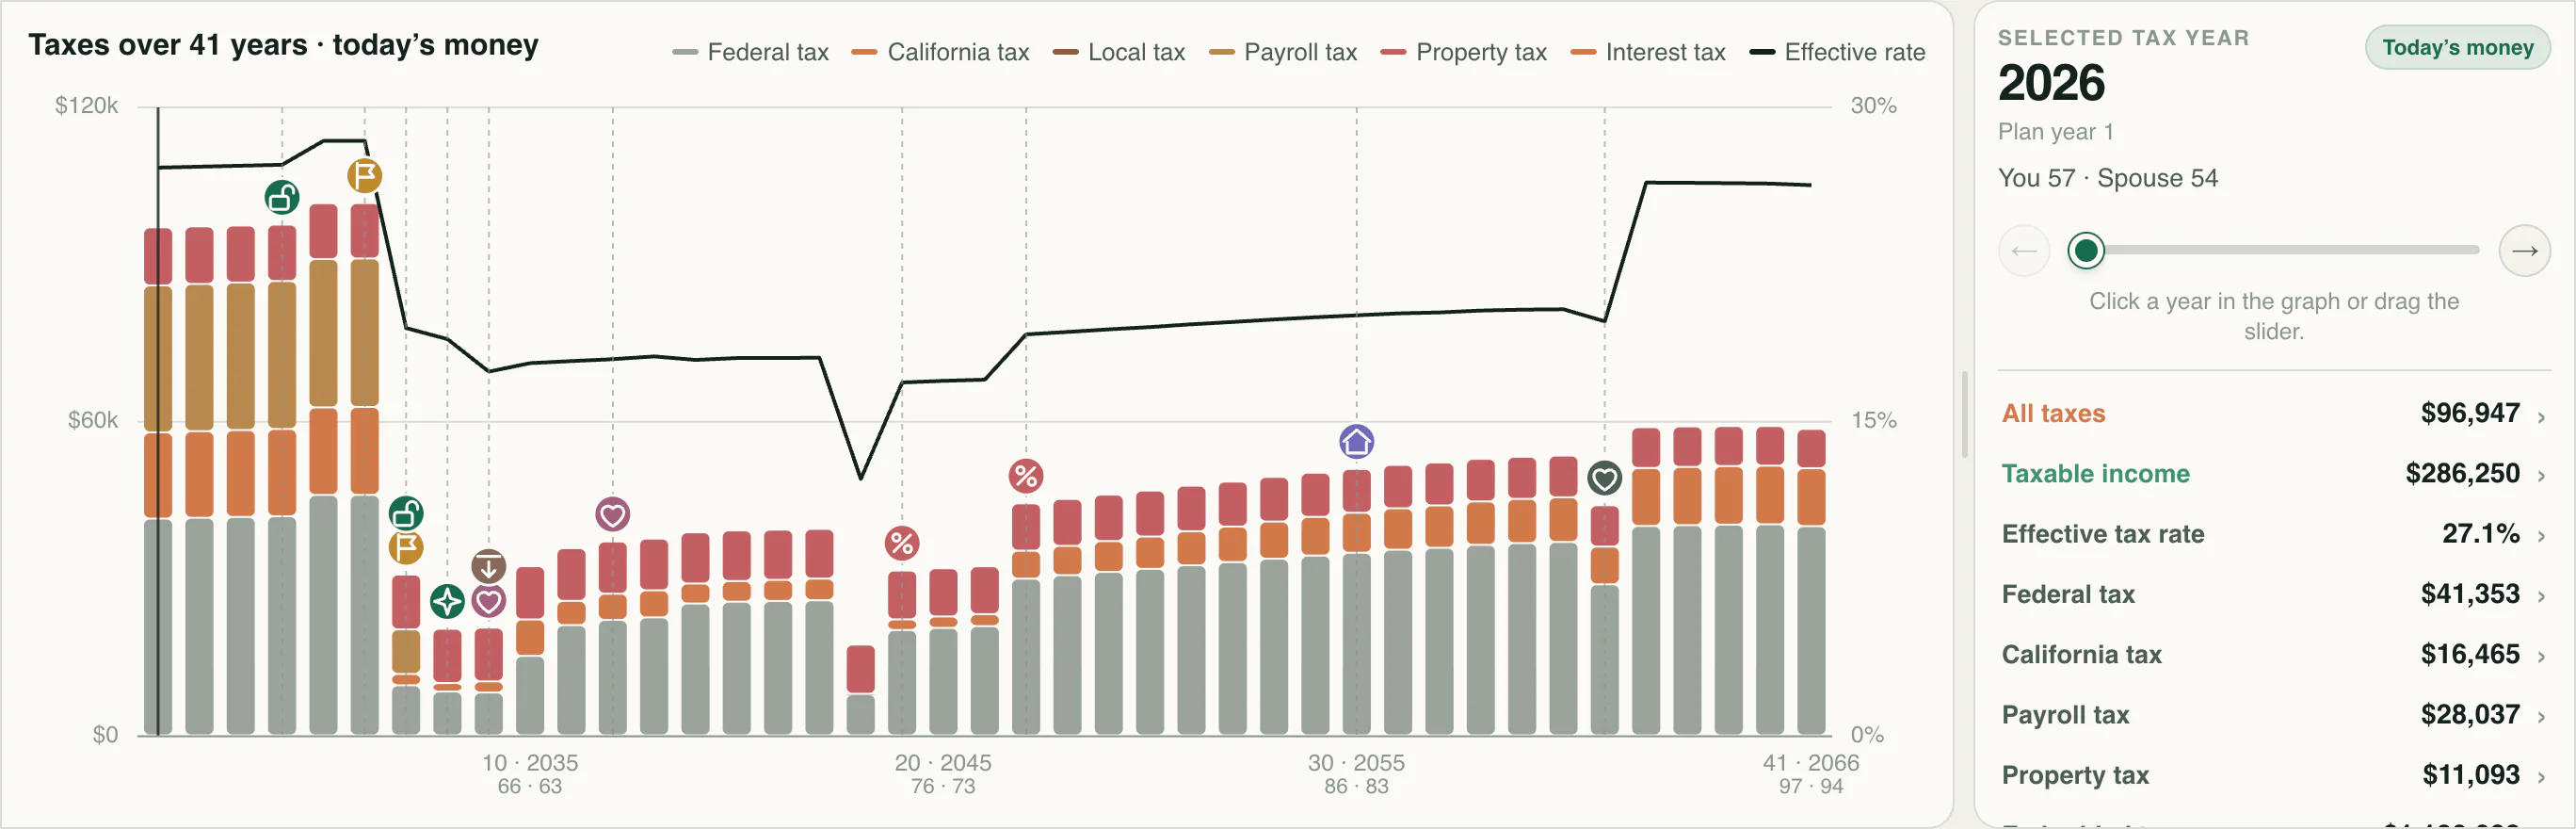
Explore estimated lifetime taxes and inspect the income, rates, and deductions behind each year.
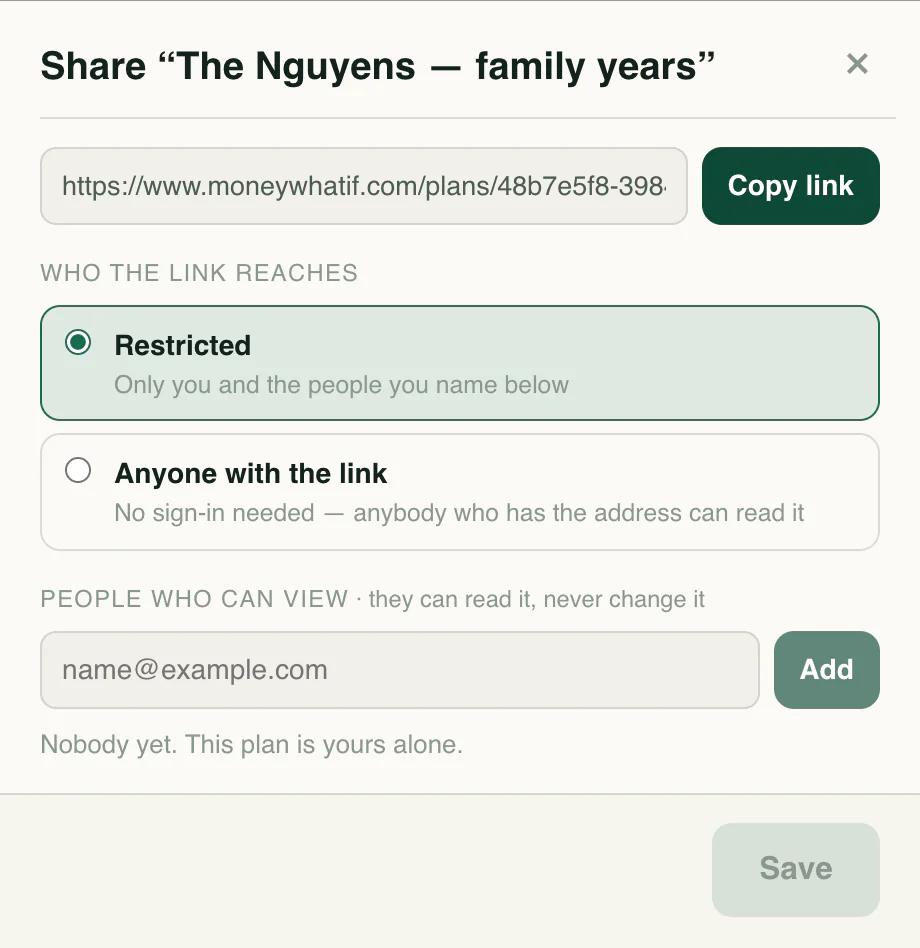
Organize household profiles and plans, then give the people you choose a read-only view.
Know the language
Your next chapter
Start with your numbers. See where they could lead.