One view of the whole journey
Income, living costs, property, taxes, and investments all feed the same year-by-year projection. See how one decision changes the rest.
Lifetime financial projections
The house. The career change. The day work becomes optional. See how the pieces of your life fit together in one connected forecast.
See what’s possible
Start with where you are today. Add the choices you’re considering, and follow their effects through the decades ahead.
Read the detailed guideIncome, living costs, property, taxes, and investments all feed the same year-by-year projection. See how one decision changes the rest.
Select a year to see the accounts, cash flow, and life events behind it. Follow an interesting result back to the numbers that explain it.
Switch between future dollars and today’s purchasing power to understand what a projected balance could actually buy.
Explore the details
A single net-worth figure brings many kinds of money together. The Accounts view gives each balance its own color, showing how contributions, growth, and withdrawals reshape the portfolio over time. Education accounts can fund an earlier chapter while retirement balances continue into the later years.
From a question to a clearer picture
A projection connects the facts you enter today with the choices you want to explore. Every chart reads that same plan from a different angle.
Enter ages, income, spending, property, and accounts through the survey or guided setup. Set the planning horizon, inflation, and return assumptions that the forecast will use.
Switch among cash flow, net worth, accounts, debt, taxes, and other built-in views. You can also compose a custom plot from the available figures and keep favorite charts close at hand.
Click a bar to pin its year and inspect the accompanying breakdown. Follow the timeline markers to understand which retirement, purchase, sale, or other event changed the pattern.
Connect the whole plan
A rising net-worth curve becomes more useful when you can explain the cash supporting it. Switch to cash flow to see how work, benefits, and account withdrawals fund each stage of life. Read a turning point in both views to understand the balance and the budget together.
One way to use it · illustrative scenario
Imagine a couple who expects to work full time until 65 but wants to explore working fewer hours from 60.
Try an example planThey open What-If, adjust the relevant income stream, and keep their current forecast as the comparison baseline.
They compare cash flow during the transition, account balances when retirement starts, and net worth later in life. Selecting individual years lets them inspect the taxes and withdrawals behind any difference.
The comparison connects the change in working income to its effects on taxes, account withdrawals, and later balances. You can see which years carry the trade-off and which assumptions matter most.
Make sense of what you see
The large chart shows the full horizon; the panel beside it explains one year. Hovering previews another year without replacing the one you pinned.
Property, cash, and retirement accounts have different roles. The account and taxable-net-worth views help you look beyond the total and examine the composition of projected wealth.
A mortgage payoff or property sale can make a year look unusual. Read the matching timeline event before treating that change as a lasting trend.
A little more detail
No. Taxes are calculated on the modeled money earned in each year. Today’s money then adjusts displayed amounts for inflation, making distant balances easier to compare with present purchasing power.
The ordinary projection follows your chosen assumptions. Historical Market Simulator and Plan resilience provide separate ways to explore changing returns. A smooth baseline alone does not measure the range of market outcomes.
Every account can read the complete projection horizon, and you can add as many items as you need in every category, during setup and after your first projection. An account keeps up to two plans.
Keep exploring
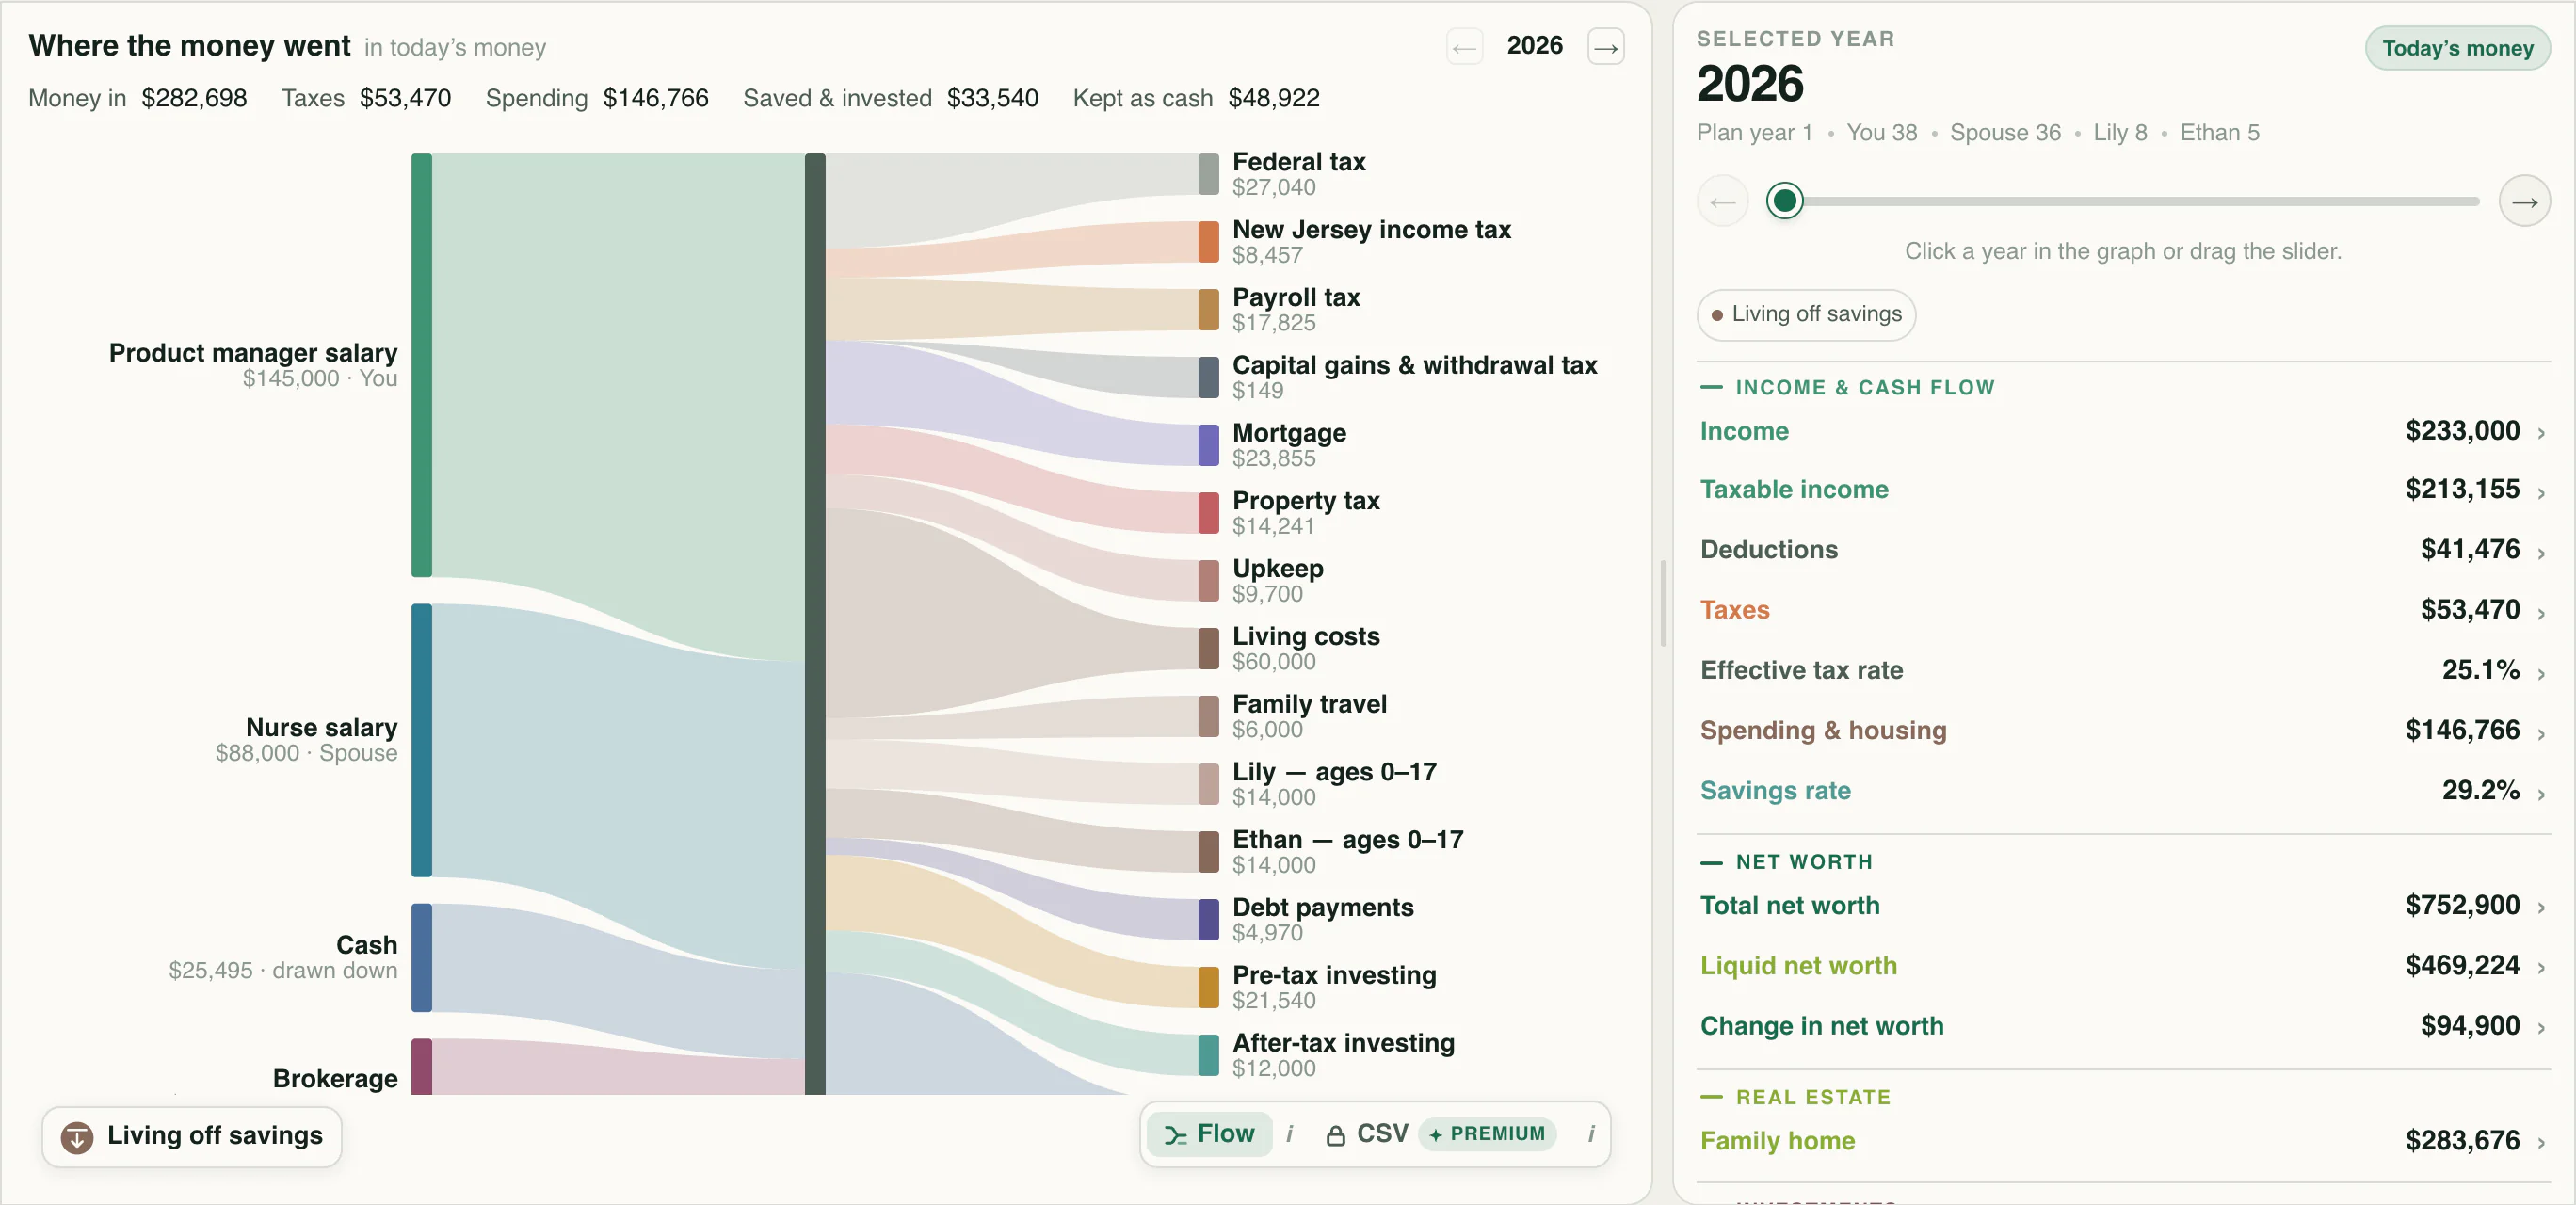
Plan household cash flow across working years and retirement. Trace income into taxes, living costs, investments, and the cash you keep.
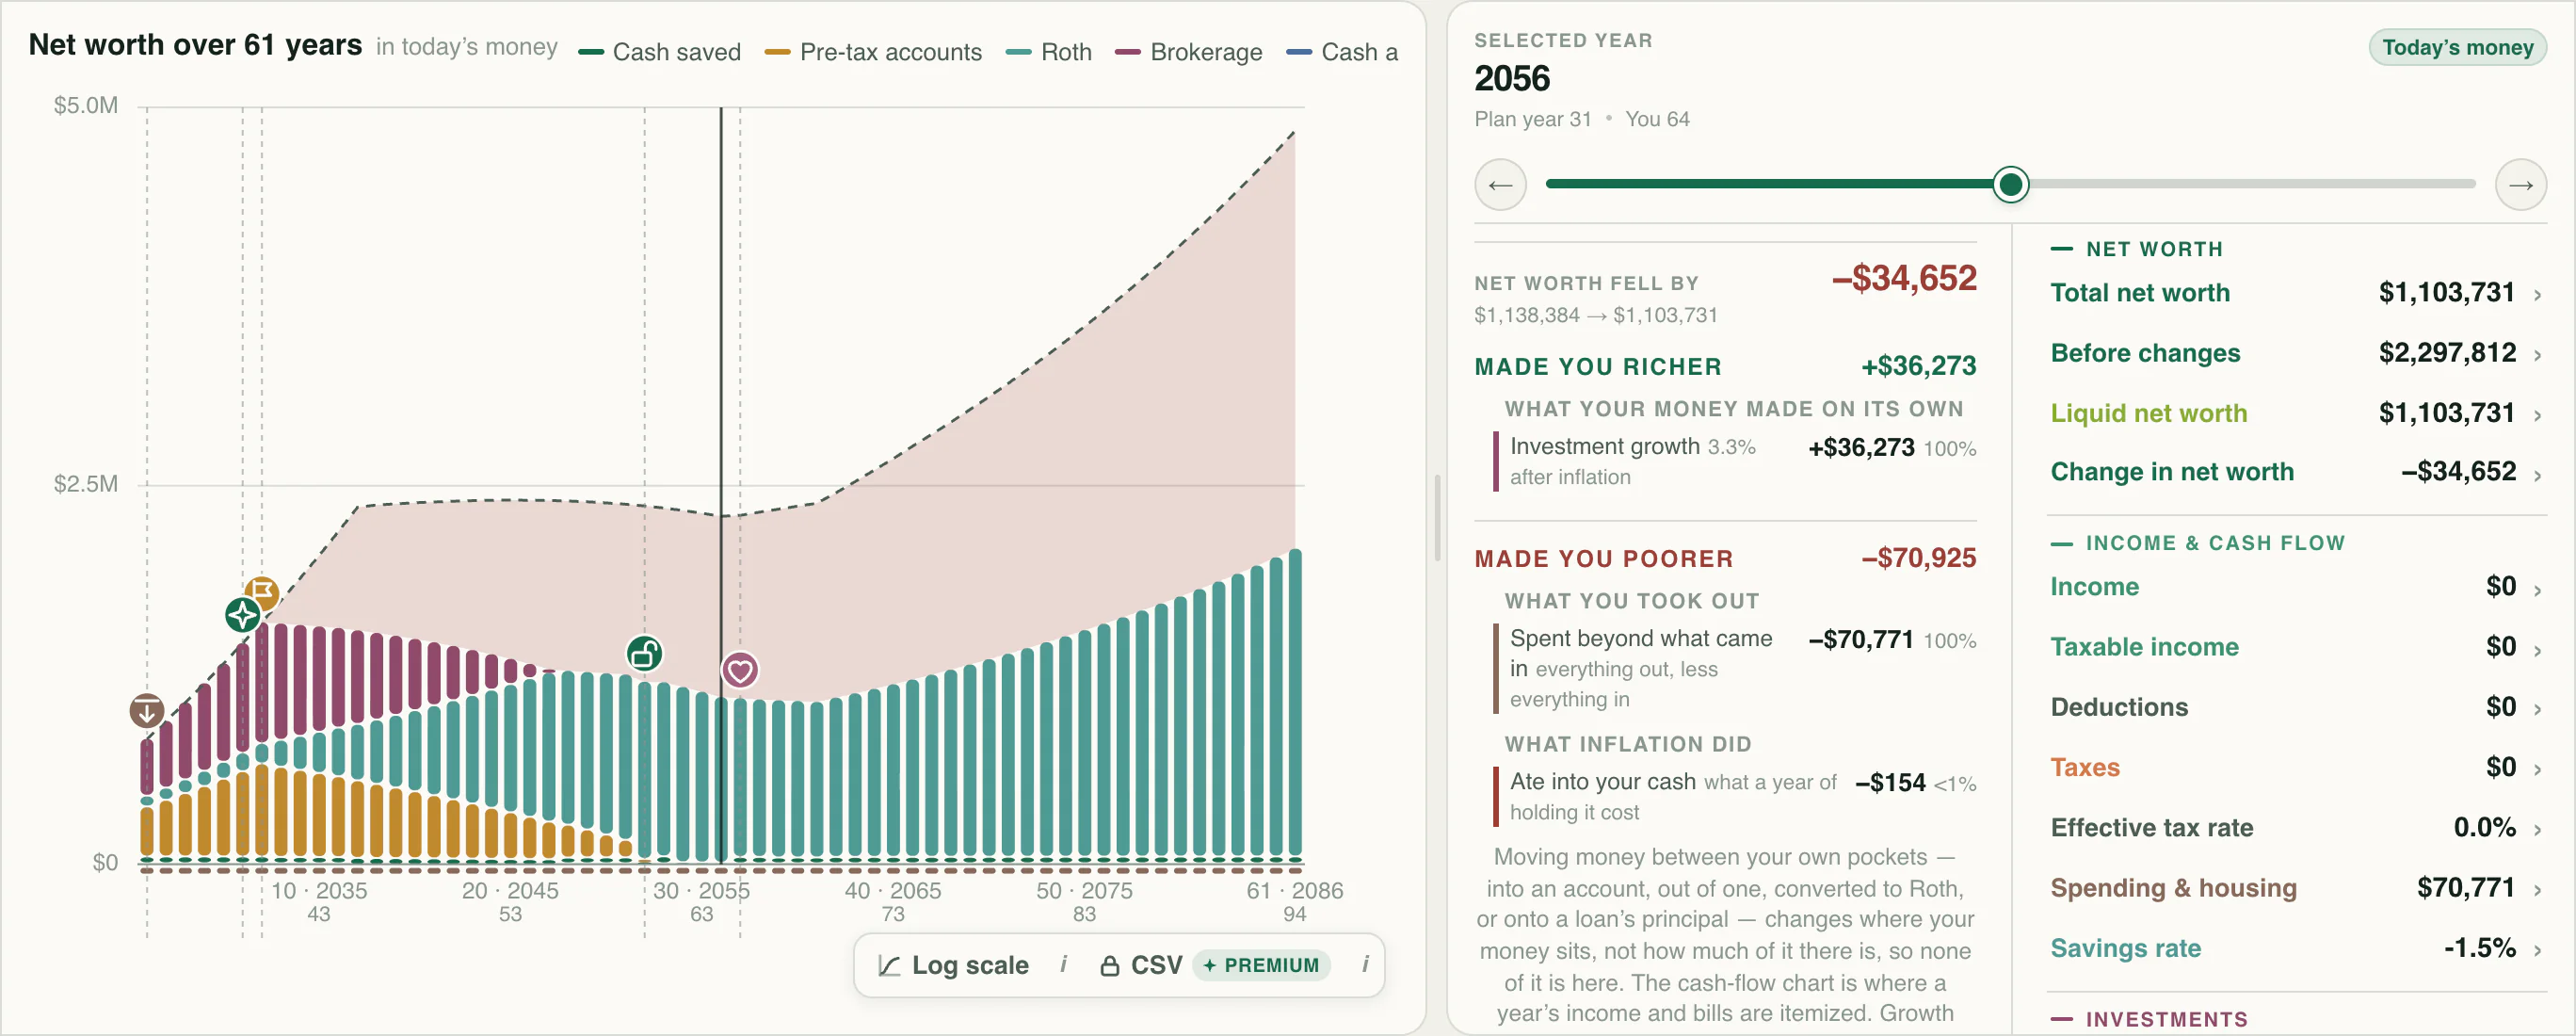
Compare financial planning scenarios for retirement dates, saving rates, career changes, and home purchases against your original forecast.
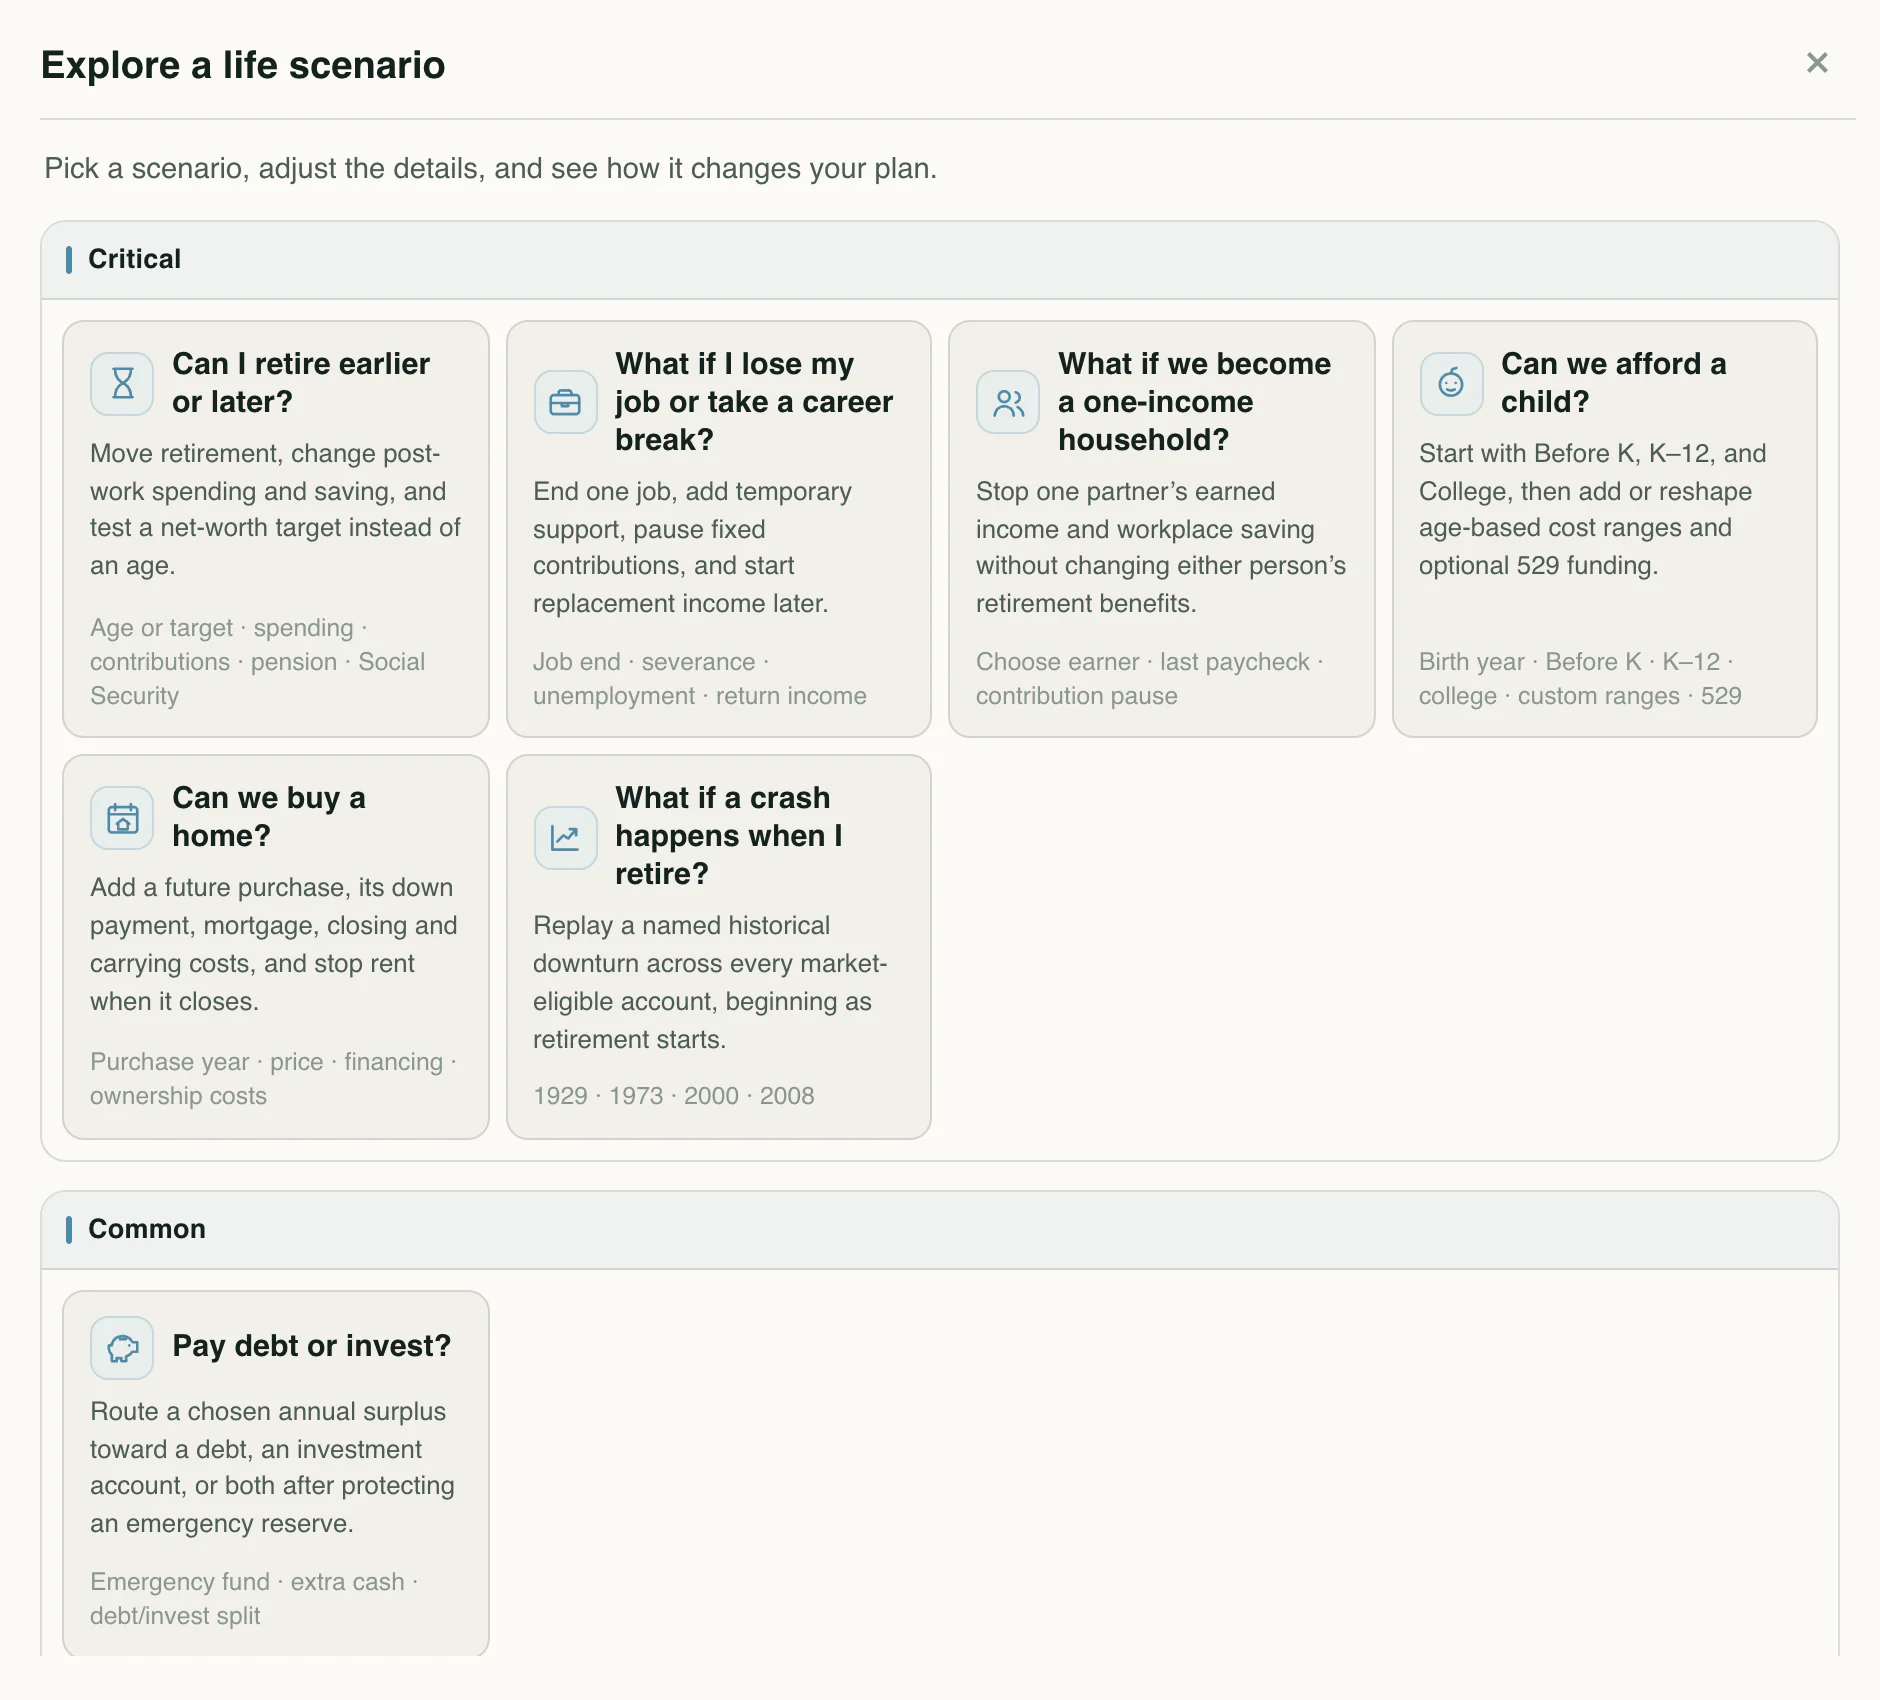
Model career changes, a growing family, education, and the milestones that make a plan yours.
Know the language
Your next chapter
Start with your numbers. See where they could lead.